
Liberty Global Ltd. (LBTYA) FY2026 Q2 Balance Sheet

Published Source: Form 10-Q on SEC EDGAR filed (opens in a new tab)

As of 2026-06-30

Balance Sheet

Swipe to see the full flow
Liberty Global Ltd. (LBTYA) FY2026 Q2 Balance SheetBalance sheet as of 2026-06-30. The chart shows assets, liabilities and equity at that date.Current liabilities$2.74 BLiabilities$12.07 BCurrent assets$3.50 BNon-current liabilities$9.33 BAssets$21.53 BNon-current assets$18.03 BEquity$9.46 BHOLDINGSASSET CLASSASSETSCLAIM CLASSCLAIM SUB-CLASSCLAIMSCash and cash equivalentsOther current assets (notes 3, 4, 5 and 6)Trade receivables, net (note 3)Investments and related notes receivable (including $1,054.6 million and $1,631.5 million, respectively, measured at fair value on a recurring basis) (note 5)Property and equipment, net (notes 8 and 10)Goodwill (note 8)Intangible assets subject to amortization, net (note 8)Other assets, net (notes 3, 6 and 10)Other accrued and current liabilities (notes 4, 6 and 10)Current portion of debt and finance lease obligations (notes 9 and 10)Accounts payableDeferred revenue (note 3)Accrued capital expendituresAccrued income taxesLong-term debt and finance lease obligations (notes 9 and 10)Other long-term liabilities (notes 3 and 6)Long-term operating lease liabilities (note 10)Accumulated earningsAccumulated other comprehensive earnings, net of taxesAdditional paid-in capitalNoncontrolling interestsCommon stock - Class ACommon stock - Class CCommon stock - Class BTreasury shares, at costCurrent assetsNon-current assetsAssetsCurrent liabilitiesNon-current liabilitiesLiabilitiesEquityEquityOther accrued and current liabilities (notes 4, 6 and 10)Other accrued and current liabilities (notes 4, 6 and 10)$1.16 BCurrent portion of debt and finance lease obligations (notes 9 and 10)Current portion of debt and finance lease obligations$620.40 MCurrent liabilitiesCurrent liabilities$2.74 BAccounts payableAccounts payable$443.00 MDeferred revenue (note 3)Deferred revenue (note 3)$247.40 MCash and cash equivalentsCash and cash equivalents$2.42 BLiabilitiesLiabilities$12.07 BCurrent assetsCurrent assets$3.50 BAccrued capital expendituresAccrued capital expenditures$168.90 MOther current assets (notes 3, 4, 5 and 6)Other current assets (notes 3, 4, 5 and 6)$558.20 MAccrued income taxesAccrued income taxes$103.90 MTrade receivables, net (note 3)Trade receivables, net (note 3)$521.20 MNon-current liabilitiesNon-current liabilities$9.33 BAssetsAssets$21.53 BLong-term debt and finance lease obligations (notes 9 and 10)Long-term debt and finance lease obligations$7.73 BOther long-term liabilities (notes 3 and 6)Other long-term liabilities (notes 3 and 6)$874.50 MInvestments and related notes receivable (including $1,054.6 million and $1,631.5 million, respectively, measured at fair value on a recurring basis) (note 5)Investments and related notes receivable$6.70 BNon-current assetsNon-current assets$18.03 BLong-term operating lease liabilities (note 10)Long-term operating lease liabilities (note 10)$723.80 MProperty and equipment, net (notes 8 and 10)Property and equipment, net (notes 8 and 10)$5.42 BEquityEquity$9.46 BAccumulated earningsAccumulated earnings$5.08 BAccumulated other comprehensive earnings, net of taxesAccumulated other comprehensive earnings, net of taxes$3.34 BGoodwill (note 8)Goodwill (note 8)$3.42 BAdditional paid-in capitalAdditional paid-in capital$805.10 MIntangible assets subject to amortization, net (note 8)Intangible assets subject to amortization, net (note 8)$1.27 BNoncontrolling interestsNoncontrolling interests$237.80 MOther assets, net (notes 3, 6 and 10)Other assets, net (notes 3, 6 and 10)$1.23 BCommon stock - Class ACommon stock - Class A$1.70 MCommon stock - Class CCommon stock - Class C$1.50 MCommon stock - Class BCommon stock - Class B$100.00 KTreasury shares, at costBought back (treasury stock)−$100.00 K
Chart details

Liberty Global Ltd. (LBTYA) FY2026 Q2 Balance Sheet

Balance sheet as of 2026-06-30. The chart shows assets, liabilities and equity at that date.

Assets
21,532,500,000 US dollars
Current assets
3,498,000,000 US dollars
Non-current assets
18,034,500,000 US dollars
Liabilities
12,070,100,000 US dollars
Current liabilities
2,741,900,000 US dollars
Non-current liabilities
9,328,200,000 US dollars
Equity
9,462,400,000 US dollars
Noncontrolling interest
237,800,000 US dollars. Included in consolidated equity; this amount is not added again.
Cash and cash equivalents
2,418,600,000 US dollars
Other current assets (notes 3, 4, 5 and 6)
558,200,000 US dollars
Trade receivables, net (note 3)
521,200,000 US dollars
Investments and related notes receivable (including $1,054.6 million and $1,631.5 million, respectively, measured at fair value on a recurring basis) (note 5)
6,700,300,000 US dollars
Property and equipment, net (notes 8 and 10)
5,422,100,000 US dollars
Goodwill (note 8)
3,415,500,000 US dollars
Intangible assets subject to amortization, net (note 8)
1,266,800,000 US dollars
Other assets, net (notes 3, 6 and 10)
1,229,800,000 US dollars
Other accrued and current liabilities (notes 4, 6 and 10)
1,158,300,000 US dollars
Current portion of debt and finance lease obligations (notes 9 and 10)
620,400,000 US dollars
Accounts payable
443,000,000 US dollars
Deferred revenue (note 3)
247,400,000 US dollars
Accrued capital expenditures
168,900,000 US dollars
Accrued income taxes
103,900,000 US dollars
Long-term debt and finance lease obligations (notes 9 and 10)
7,729,900,000 US dollars
Other long-term liabilities (notes 3 and 6)
874,500,000 US dollars
Long-term operating lease liabilities (note 10)
723,800,000 US dollars
Accumulated earnings
5,077,200,000 US dollars
Accumulated other comprehensive earnings, net of taxes
3,339,100,000 US dollars
Additional paid-in capital
805,100,000 US dollars
Common stock - Class A
1,700,000 US dollars
Common stock - Class C
1,500,000 US dollars
Common stock - Class B
100,000 US dollars
Noncontrolling interests
237,800,000 US dollars
Treasury shares, at cost
negative 100,000 US dollars

Chart connections

  • Assets equal liabilities plus consolidated equity. Consolidated equity includes noncontrolling interests when reported.
  • Treasury shares and other negative equity contributions reduce equity.
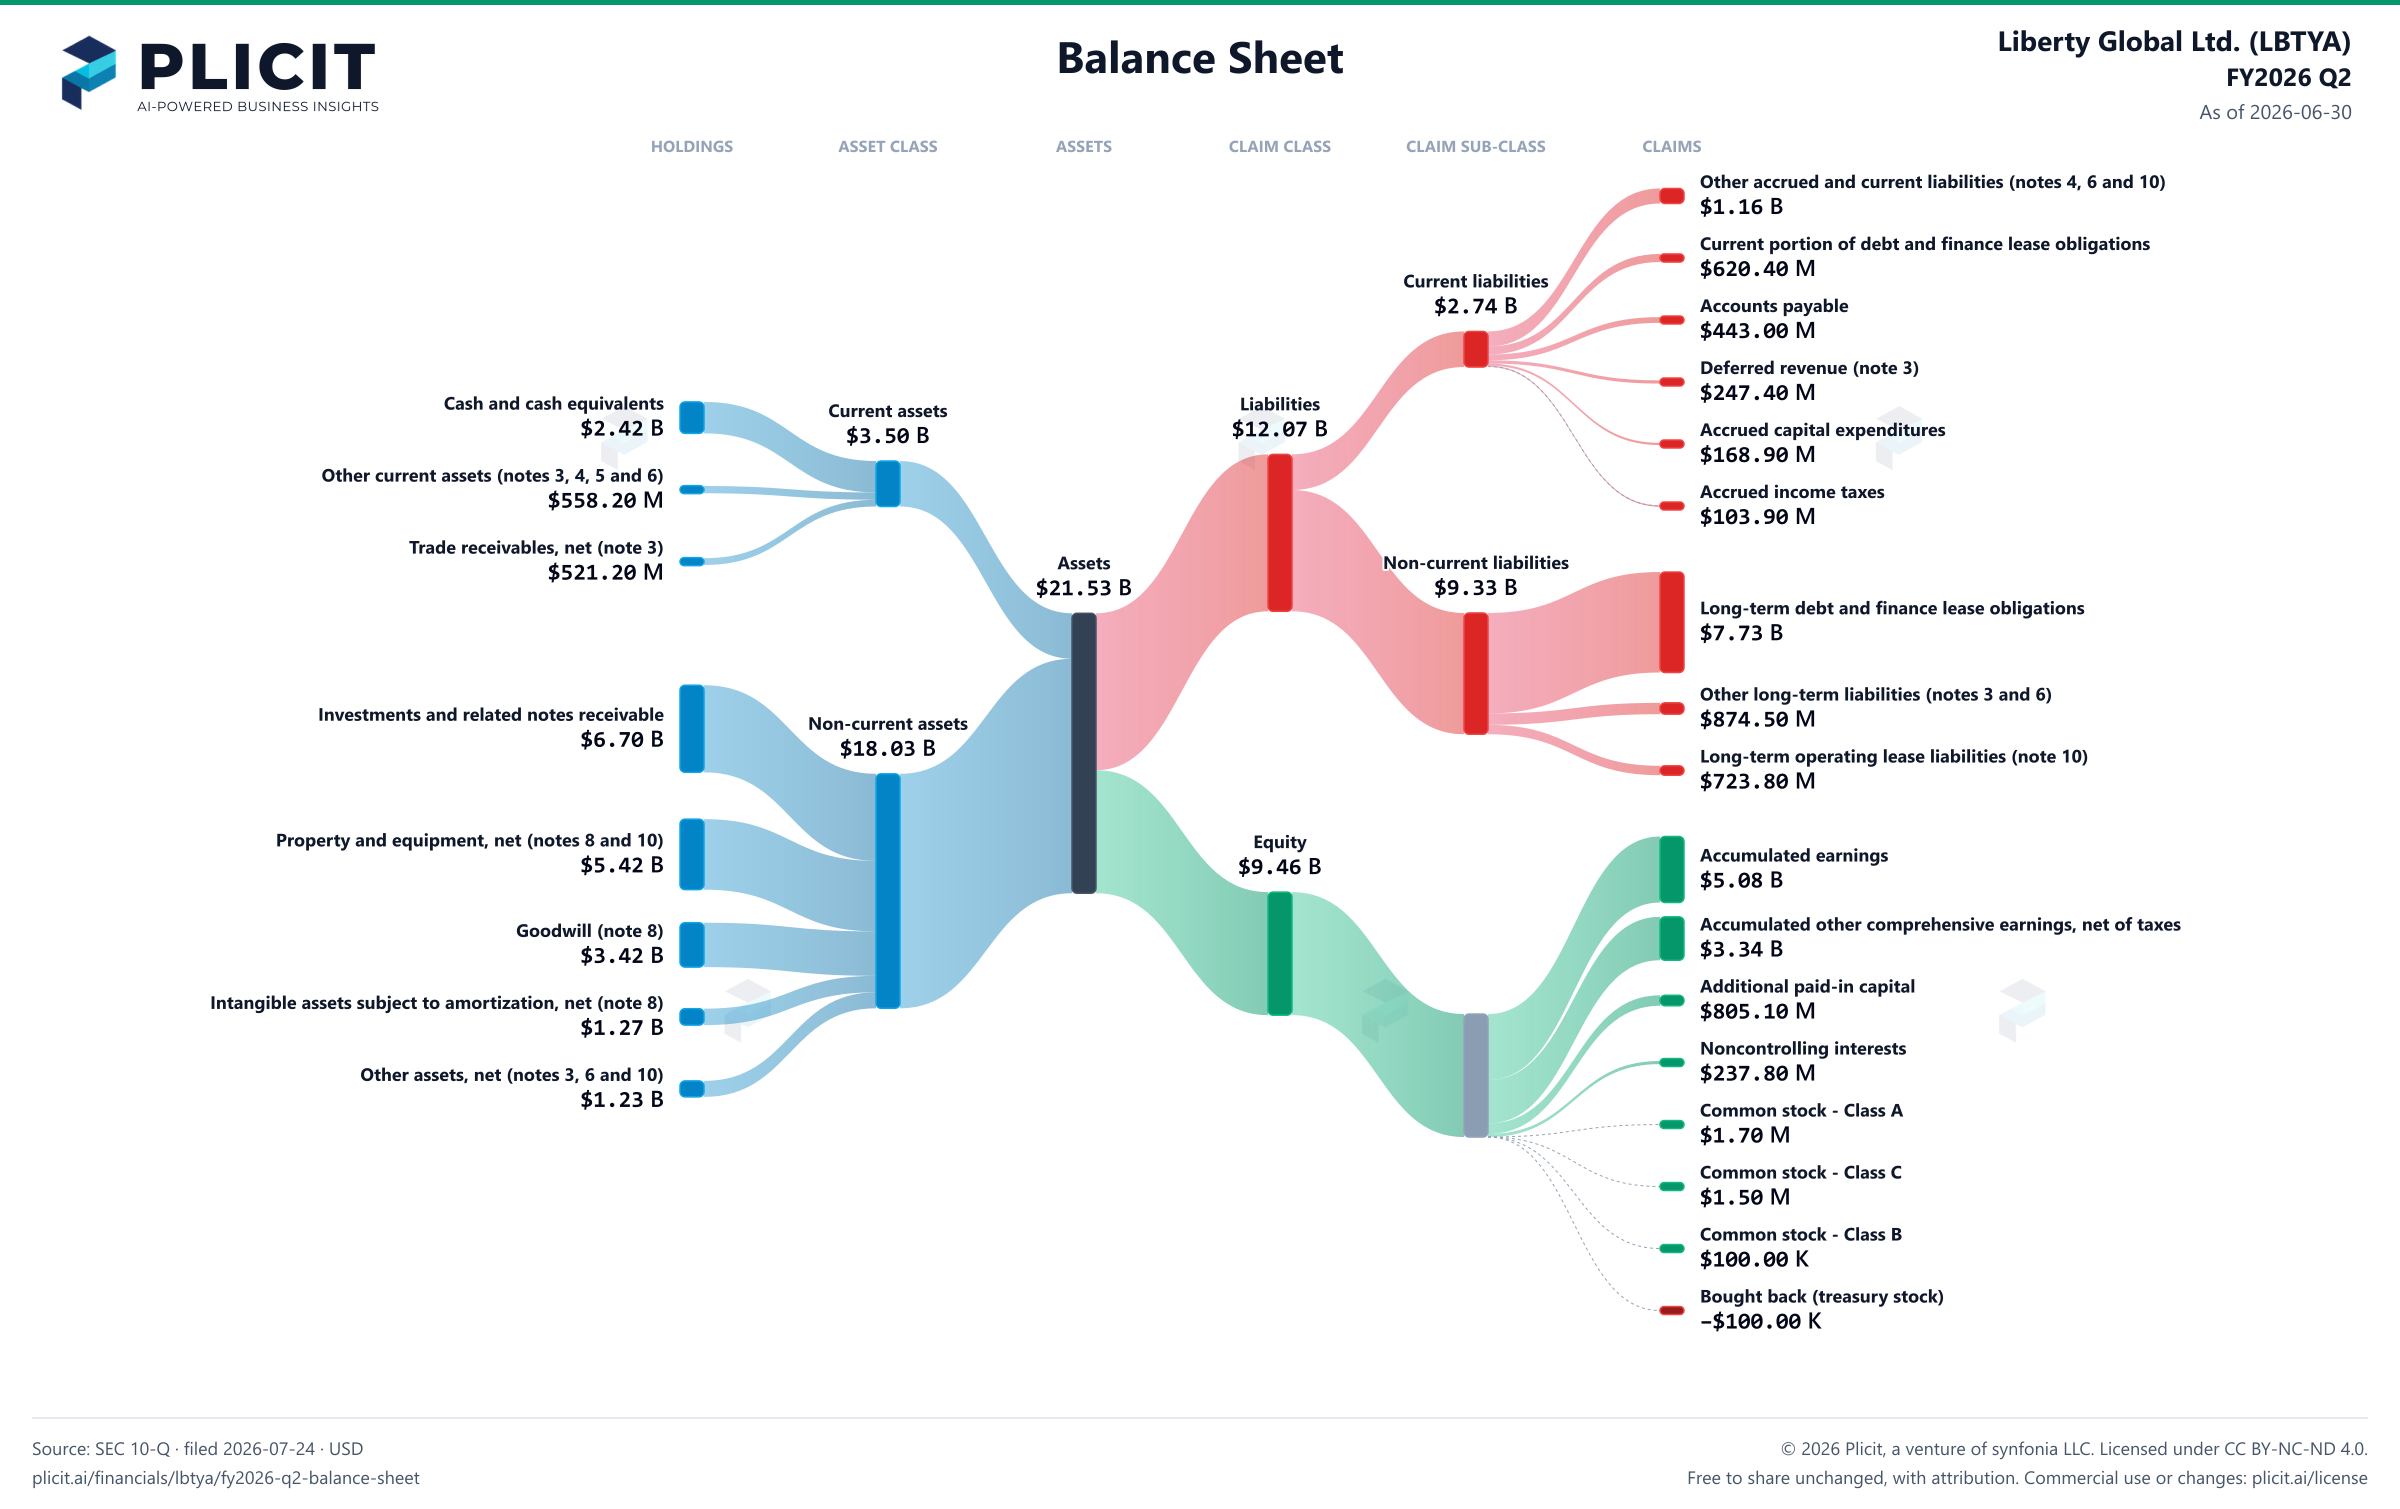
Liberty Global Ltd. (LBTYA) FY2026 Q2 Balance Sheet Sankey chart
Free to share unchanged, with credit to Plicit.ai · CC BY-NC-ND 4.0Download PNG

Product waitlist

Health Check and Teardown for your own company

A health check uncovers insights of your private books, not a public ticker. Join this list to get notified as soon as we go-live!