
Lucid Group, Inc. (LCID) FY2026 Q2 Balance Sheet

Balance Sheet

As of 2026-06-30

Swipe to see the full flow
Lucid Group, Inc. (LCID) FY2026 Q2 Balance SheetBalance sheet as of 2026-06-30. The chart shows assets, liabilities and equity at that date.Current liabilities$2.44 BLiabilities$5.85 BNon-current liabilities$3.41 BCurrent assets$2.78 BAssets$7.70 BNon-current assets$4.92 BEquity−$1.06 BRedeemableconvertible preferredstock, (related party)$2.91 BHOLDINGSASSET CLASSASSETSCLAIM CLASSCLAIM SUB-CLASSCLAIMSInventoryCash and cash equivalentsOther current assetsAccounts receivable, net (including $186,581 and $120,540 from a related party as of June 30, 2026 and December 31, 2025, respectively)Prepaid expensesShort-term investments (including nil and $50,000 associated with a related party as of June 30, 2026 and December 31, 2025, respectively)Property, plant and equipment, netOther noncurrent assetsRight-of-use assetsLong-term investments (including $14,191 and $24,259 associated with a related party as of June 30, 2026 and December 31, 2025, respectively)Other current liabilities (including $73,134 and $81,580 associated with a related party as of June 30, 2026 and December 31, 2025, respectively)Current portion of debt ($503,088 and $467,963 associated with a related party as of June 30, 2026 and December 31, 2025, respectively)Accounts payableFinance lease liabilities, current portionDebt, net of current portion (including $497,426 and nil associated with a related party as of June 30, 2026 and December 31, 2025, respectively)Other long-term liabilities (including $123,504 and $123,198 associated with related parties as of June 30, 2026 and December 31, 2025, respectively)Derivative liabilities associated with redeemable convertible preferred stock (related party)Finance lease liabilities, net of current portionAdditional paid-in capitalAccumulated other comprehensive incomeCommon stock, par value $0.0001; 1,500,000,000 shares authorized as of June 30, 2026 and December 31, 2025; 394,155,958 and 327,451,844 shares issued and 394,070,176 and 327,366,062 shares outstanding as of June 30, 2026 and December 31, 2025, respectivelyAccumulated deficitTreasury stock, at cost, 85,782 shares at June 30, 2026 and December 31, 2025Current assetsNon-current assetsAssetsCurrent liabilitiesNon-current liabilitiesLiabilitiesEquityRedeemable convertible preferred stock, (related party)Current liabilitiesCurrent liabilities$2.44 BOther current liabilities (including $73,134 and $81,580 associated with a related party as of June 30, 2026 and December 31, 2025, respectively)Other current liabilities$1.36 BCurrent portion of debt ($503,088 and $467,963 associated with a related party as of June 30, 2026 and December 31, 2025, respectively)Current portion of debt$707.14 MLiabilitiesLiabilities$5.85 BAccounts payableAccounts payable$366.91 MFinance lease liabilities, current portionFinance lease liabilities, current portion$5.05 MNon-current liabilitiesNon-current liabilities$3.41 BDebt, net of current portion (including $497,426 and nil associated with a related party as of June 30, 2026 and December 31, 2025, respectively)Debt, net$2.55 BOther long-term liabilities (including $123,504 and $123,198 associated with related parties as of June 30, 2026 and December 31, 2025, respectively)Other long-term liabilities$599.44 MDerivative liabilities associated with redeemable convertible preferred stock (related party)Derivative liabilities associated with redeemableconvertible preferred stock (related party)$163.66 MFinance lease liabilities, net of current portionFinance lease liabilities, net of current portion$102.69 MInventoryInventory$1.38 BCurrent assetsCurrent assets$2.78 BCash and cash equivalentsCash and cash equivalents$732.60 MOther current assetsOther current assets$341.07 MAssetsAssets$7.70 BAdditional paid-in capitalAdditional paid-in capital$16.64 BAccounts receivable, net (including $186,581 and $120,540 from a related party as of June 30, 2026 and December 31, 2025, respectively)Accounts receivable, net$223.05 MPrepaid expensesPrepaid expenses$72.46 MShort-term investments (including nil and $50,000 associated with a related party as of June 30, 2026 and December 31, 2025, respectively)Short-term investments$28.71 MNon-current assetsNon-current assets$4.92 BProperty, plant and equipment, netProperty, plant and equipment, net$4.22 BEquityEquity−$1.06 BAccumulated other comprehensive incomeAccumulated other comprehensive income$615.00 KOther noncurrent assetsOther noncurrent assets$436.23 MCommon stock, par value $0.0001; 1,500,000,000 shares authorized as of June 30, 2026 and December 31, 2025; 394,155,958 and 327,451,844 shares issued and 394,070,176 and 327,366,062 shares outstanding as of June 30, 2026 and December 31, 2025, respectivelyCommon stock$39.00 KRight-of-use assetsRight-of-use assets$249.02 MLong-term investments (including $14,191 and $24,259 associated with a related party as of June 30, 2026 and December 31, 2025, respectively)Long-term investments$14.19 MRedeemable convertible preferred stock, (related party)Redeemableconvertible preferredstock, (related party)$2.91 BAccumulated deficitAccumulated deficit−$17.67 BTreasury stock, at cost, 85,782 shares at June 30, 2026 and December 31, 2025Treasury stock−$20.72 M
Chart details

Lucid Group, Inc. (LCID) FY2026 Q2 Balance Sheet

Balance sheet as of 2026-06-30. The chart shows assets, liabilities and equity at that date.

Assets
7,698,826,000 US dollars
Current assets
2,776,541,000 US dollars
Non-current assets
4,922,285,000 US dollars
Liabilities
5,850,532,000 US dollars
Current liabilities
2,438,195,000 US dollars
Non-current liabilities
3,412,337,000 US dollars
Equity
negative 1,057,963,000 US dollars
Redeemable convertible preferred stock, (related party)
2,906,257,000 US dollars
Inventory
1,378,653,000 US dollars
Cash and cash equivalents
732,601,000 US dollars
Other current assets
341,067,000 US dollars
Accounts receivable, net (including $186,581 and $120,540 from a related party as of June 30, 2026 and December 31, 2025, respectively)
223,050,000 US dollars
Prepaid expenses
72,458,000 US dollars
Short-term investments (including nil and $50,000 associated with a related party as of June 30, 2026 and December 31, 2025, respectively)
28,712,000 US dollars
Property, plant and equipment, net
4,222,841,000 US dollars
Other noncurrent assets
436,234,000 US dollars
Right-of-use assets
249,019,000 US dollars
Long-term investments (including $14,191 and $24,259 associated with a related party as of June 30, 2026 and December 31, 2025, respectively)
14,191,000 US dollars
Other current liabilities (including $73,134 and $81,580 associated with a related party as of June 30, 2026 and December 31, 2025, respectively)
1,359,101,000 US dollars
Current portion of debt ($503,088 and $467,963 associated with a related party as of June 30, 2026 and December 31, 2025, respectively)
707,142,000 US dollars
Accounts payable
366,907,000 US dollars
Finance lease liabilities, current portion
5,045,000 US dollars
Debt, net of current portion (including $497,426 and nil associated with a related party as of June 30, 2026 and December 31, 2025, respectively)
2,546,556,000 US dollars
Other long-term liabilities (including $123,504 and $123,198 associated with related parties as of June 30, 2026 and December 31, 2025, respectively)
599,441,000 US dollars
Derivative liabilities associated with redeemable convertible preferred stock (related party)
163,655,000 US dollars
Finance lease liabilities, net of current portion
102,685,000 US dollars
Additional paid-in capital
16,636,039,000 US dollars
Accumulated other comprehensive income
615,000 US dollars
Common stock, par value $0.0001; 1,500,000,000 shares authorized as of June 30, 2026 and December 31, 2025; 394,155,958 and 327,451,844 shares issued and 394,070,176 and 327,366,062 shares outstanding as of June 30, 2026 and December 31, 2025, respectively
39,000 US dollars
Accumulated deficit
negative 17,673,940,000 US dollars
Treasury stock, at cost, 85,782 shares at June 30, 2026 and December 31, 2025
negative 20,716,000 US dollars

Chart connections

  • Assets equal liabilities plus temporary equity plus consolidated equity. Consolidated equity includes noncontrolling interests when reported.
  • Treasury shares and other negative equity contributions reduce equity.
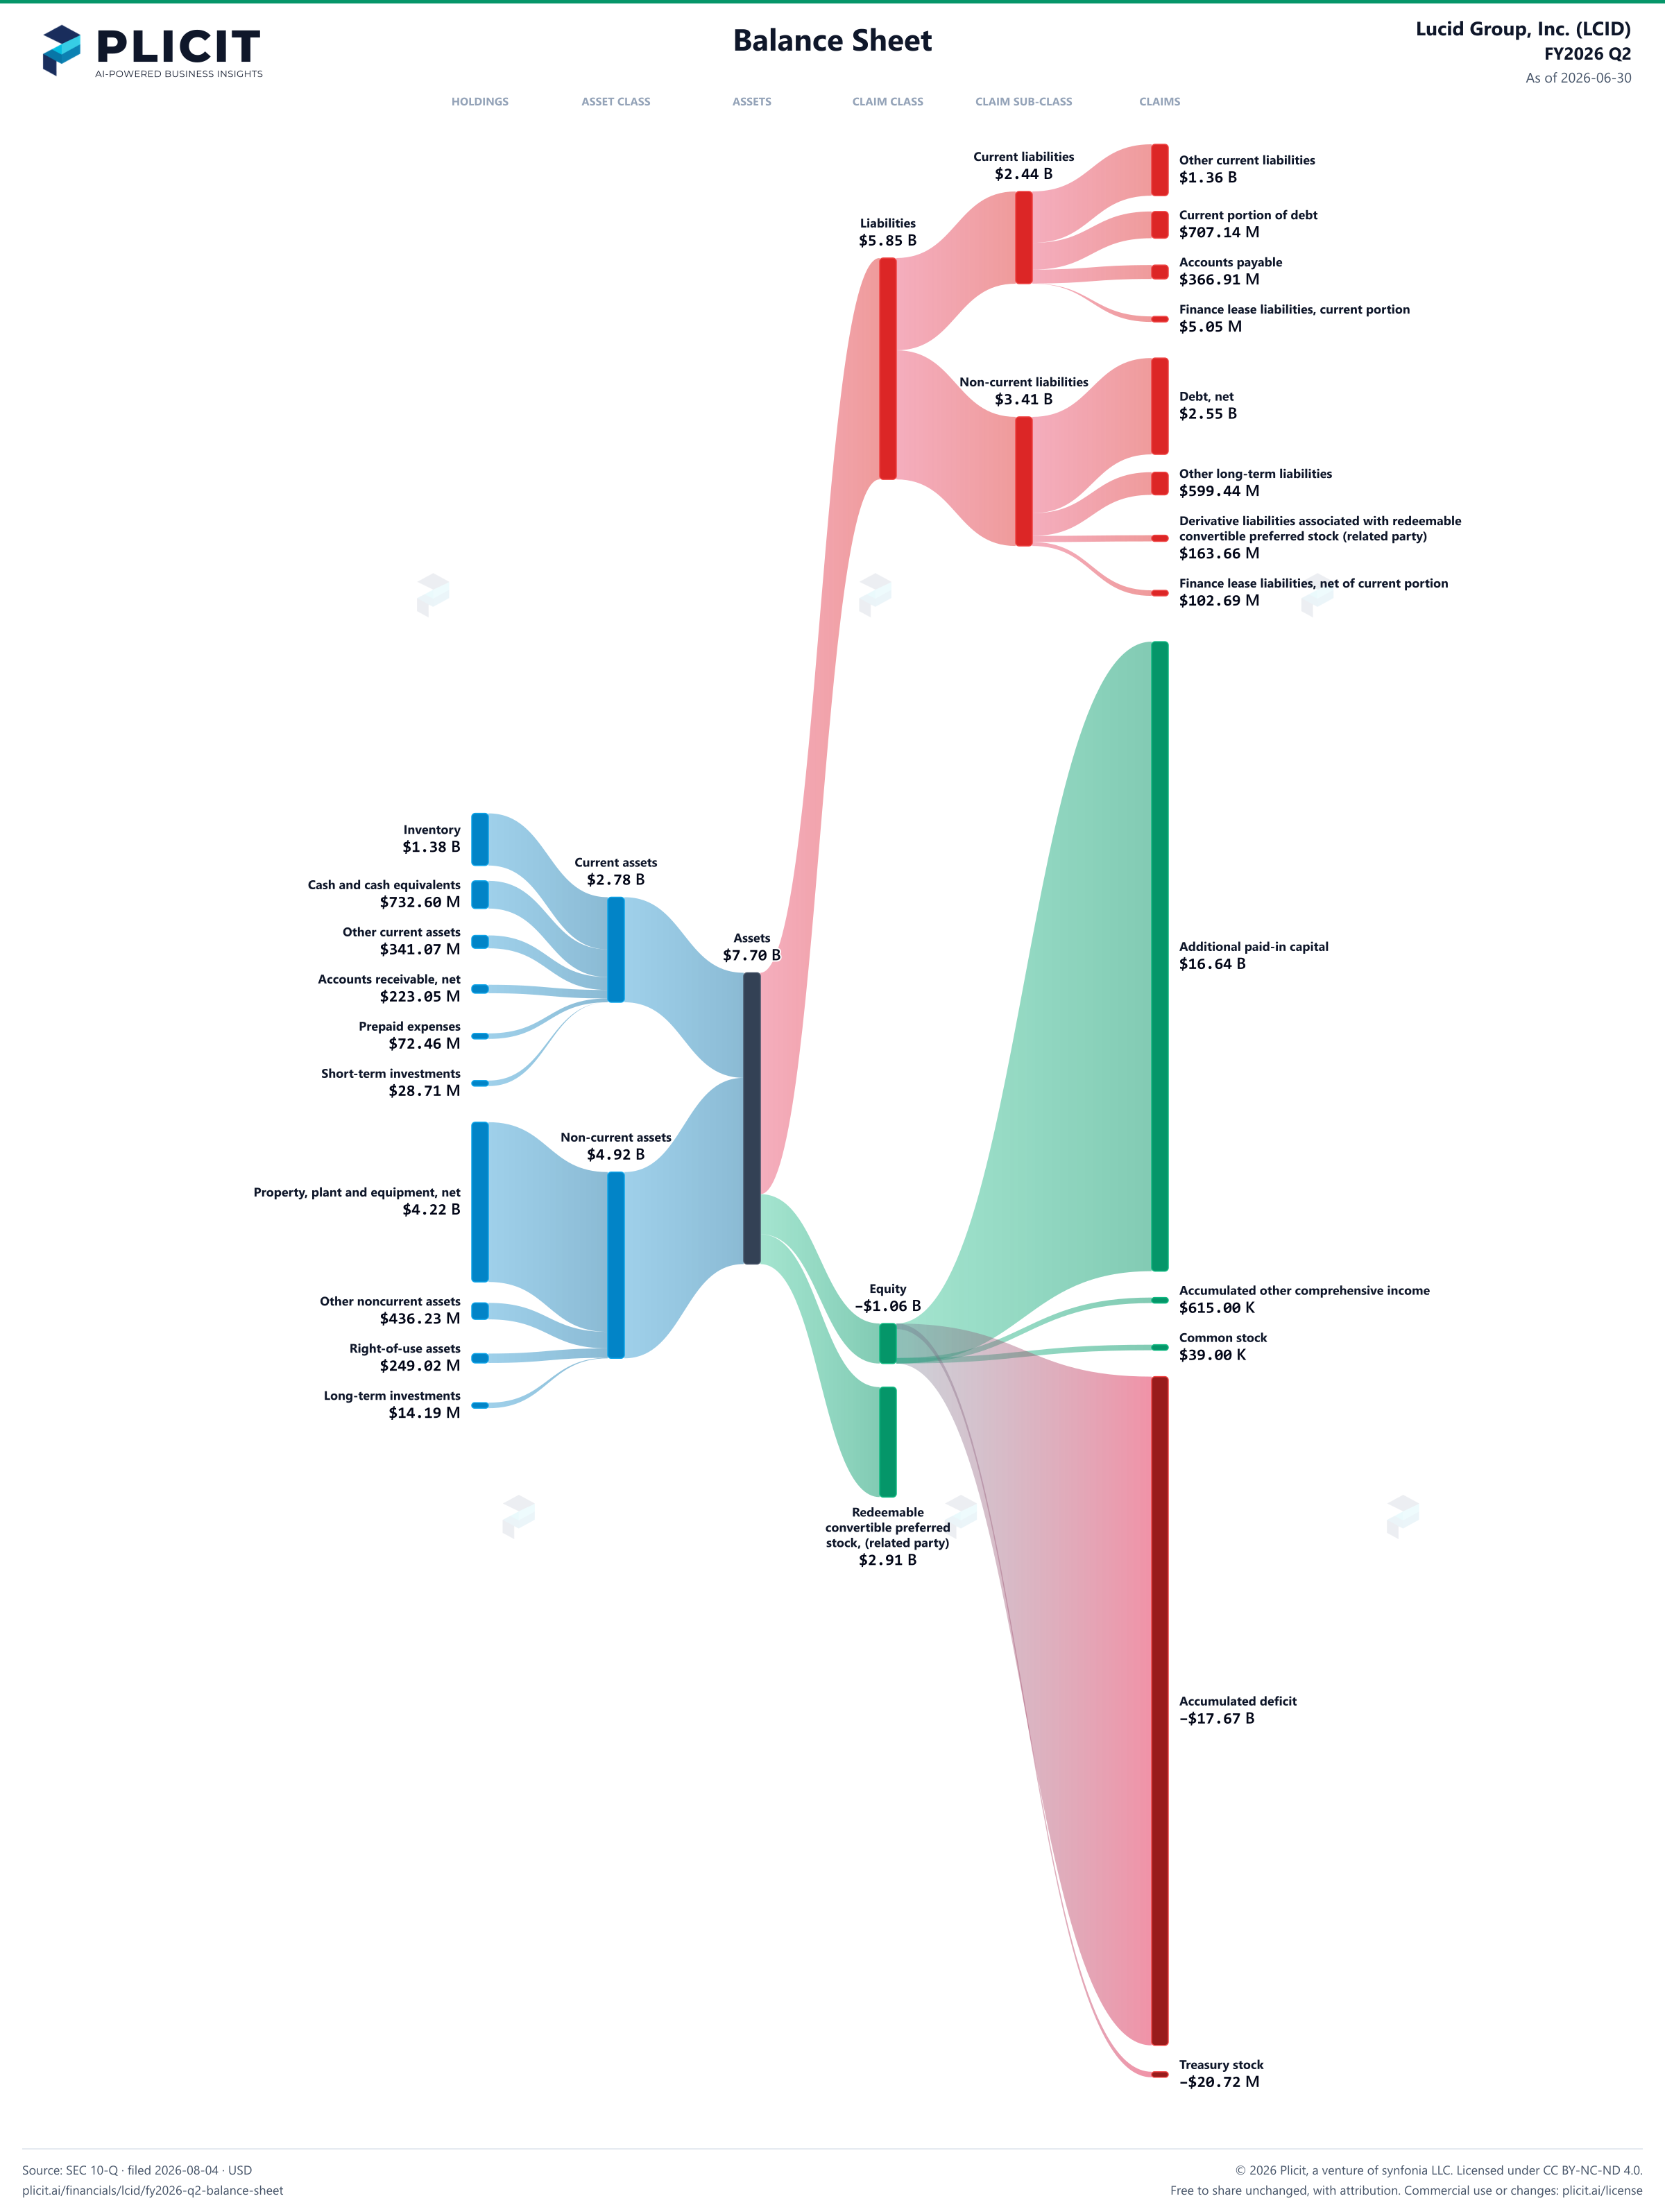
Lucid Group, Inc. (LCID) FY2026 Q2 Balance Sheet Sankey chart
Free to share unchanged, with credit to Plicit.ai · CC BY-NC-ND 4.0Download PNG

Newsletter

Get the teardowns by email

Subscribe if you want the public-company teardowns in your inbox when they're released.

Product waitlist

Health Check and Teardown for your own company

A health check uncovers insights of your private books, not a public ticker. Join this list to get notified as soon as we go-live!