
LOWE’S COMPANIES, INC. (LOW) FY2024 Q3 Balance Sheet
As of 2024-11-01
Balance Sheet
As of 2024-11-01
Swipe to see the full flow
Chart details
LOWE’S COMPANIES, INC. (LOW) FY2024 Q3 Balance Sheet
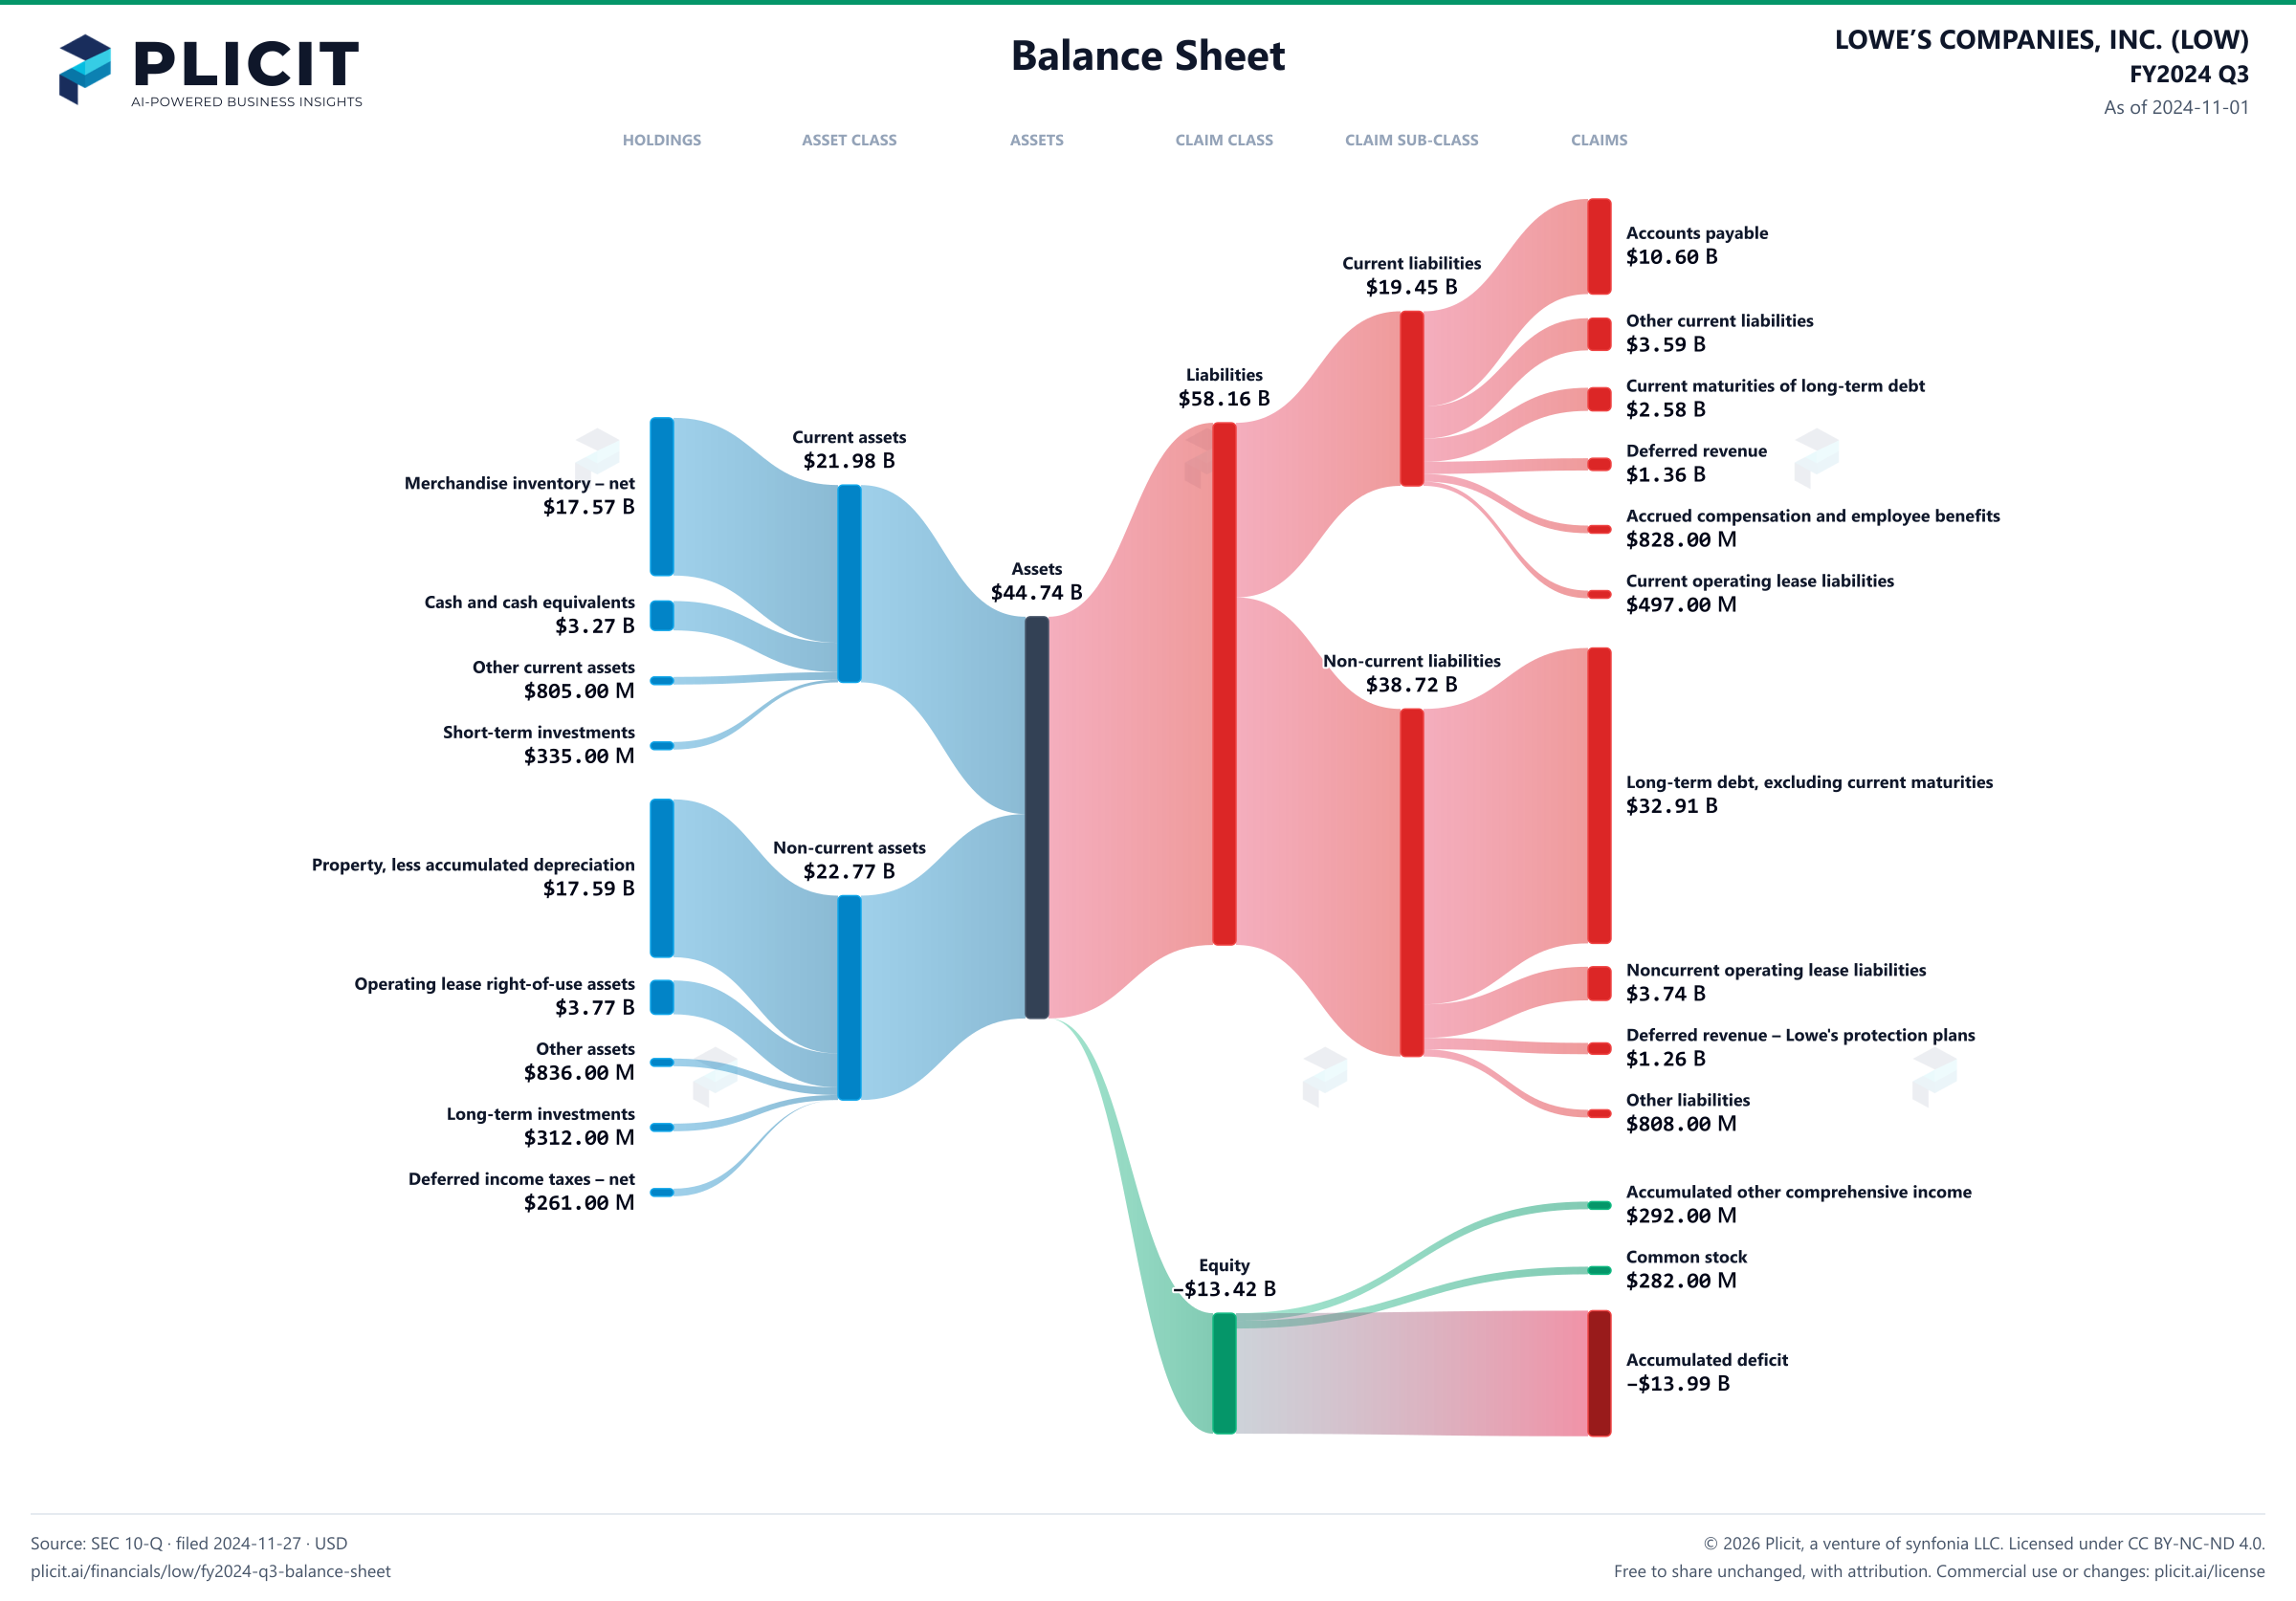
Balance sheet as of 2024-11-01. The chart shows assets, liabilities and equity at that date.
- Assets
- 44,743,000,000 US dollars
- Current assets
- 21,977,000,000 US dollars
- Non-current assets
- 22,766,000,000 US dollars
- Liabilities
- 58,162,000,000 US dollars
- Current liabilities
- 19,447,000,000 US dollars
- Non-current liabilities
- 38,715,000,000 US dollars
- Equity
- negative 13,419,000,000 US dollars
- Merchandise inventory – net
- 17,566,000,000 US dollars
- Cash and cash equivalents
- 3,271,000,000 US dollars
- Other current assets
- 805,000,000 US dollars
- Short-term investments
- 335,000,000 US dollars
- Property, less accumulated depreciation
- 17,586,000,000 US dollars
- Operating lease right-of-use assets
- 3,771,000,000 US dollars
- Other assets
- 836,000,000 US dollars
- Long-term investments
- 312,000,000 US dollars
- Deferred income taxes – net
- 261,000,000 US dollars
- Accounts payable
- 10,602,000,000 US dollars
- Other current liabilities
- 3,585,000,000 US dollars
- Current maturities of long-term debt
- 2,576,000,000 US dollars
- Deferred revenue
- 1,359,000,000 US dollars
- Accrued compensation and employee benefits
- 828,000,000 US dollars
- Current operating lease liabilities
- 497,000,000 US dollars
- Long-term debt, excluding current maturities
- 32,906,000,000 US dollars
- Noncurrent operating lease liabilities
- 3,741,000,000 US dollars
- Deferred revenue – Lowe's protection plans
- 1,260,000,000 US dollars
- Other liabilities
- 808,000,000 US dollars
- Accumulated other comprehensive income
- 292,000,000 US dollars
- Common stock, $0.50 par value: Authorized - 5.6 billion shares; Issued and outstanding - 565 million, 574 million, and 575 million shares
- 282,000,000 US dollars
- Preferred stock, $5 par value: Authorized – 5.0 million shares; Issued and outstanding – none
- 0 US dollars
- Capital in excess of par value
- 0 US dollars
- Accumulated deficit
- negative 13,993,000,000 US dollars
Chart connections
- Assets equal liabilities plus consolidated equity. Consolidated equity includes noncontrolling interests when reported.
- Treasury shares and other negative equity contributions reduce equity.
Free to share unchanged, with credit to Plicit.ai · CC BY-NC-ND 4.0Download PNG
Product waitlist
Health Check and Teardown for your own company
A health check uncovers insights of your private books, not a public ticker. Join this list to get notified as soon as we go-live!