
MDU RESOURCES GROUP, INC. (MDU) FY2026 Q2 Balance Sheet

Balance Sheet

As of 2026-06-30

Swipe to see the full flow
MDU RESOURCES GROUP, INC. (MDU) FY2026 Q2 Balance SheetBalance sheet as of 2026-06-30. The chart shows assets, liabilities and equity at that date.Current liabilities$499.73 MCurrent assets$495.98 MLiabilities(calculated)$4.79 BAssets$7.71 BNon-current assets$7.22 BNon-current liabilities$4.29 BEquity$2.93 BGross equity(calculated)$2.94 BHOLDINGSASSET CLASSASSETSCLAIM CLASSCLAIM SUB-CLASSCLAIMSCurrent regulatory assetsReceivables, netPrepayments and other current assetsCash, cash equivalents and restricted cashCurrent environmental allowancesInventoriesNet property, plant and equipmentGoodwillRegulatory assetsOtherEnvironmental allowancesInvestmentsRegulatory liabilities due within one yearOther accrued liabilitiesAccounts payableTaxes payableDividends payableCurrent environmental obligationsAccrued compensationLong-term debt due within one yearLong-term debtRegulatory liabilitiesDeferred income taxesAsset retirement obligationsOtherEnvironmental obligationsOther paid-in capitalRetained earningsCommon stock Authorized - 500,000,000 shares, $1.00 par value Shares issued - 210,349,456 at June 30, 2026, 204,331,170 at June 30, 2025 and 204,382,821 at December 31, 2025Current assetsNon-current assetsAssetsCurrent liabilitiesNon-current liabilitiesLiabilities (calculated)EquityGross equity (calculated)Accumulated other comprehensive lossRegulatory liabilities due within one yearRegulatory liabilities due within one year$156.95 MOther accrued liabilitiesOther accrued liabilities$118.04 MCurrent regulatory assetsCurrent regulatory assets$192.79 MAccounts payableAccounts payable$110.74 MReceivables, netReceivables, net$151.69 MCurrent liabilitiesCurrent liabilities$499.73 MTaxes payableTaxes payable$34.36 MCurrent assetsCurrent assets$495.98 MPrepayments and other current assetsPrepayments and other current assets$61.65 MDividends payableDividends payable$29.45 MCash, cash equivalents and restricted cashCash, cash equivalents and restricted cash$46.27 MCurrent environmental obligationsCurrent environmental obligations$24.09 MLiabilities (calculated)Liabilities(calculated)$4.79 BAssetsAssets$7.71 BCurrent environmental allowancesCurrent environmental allowances$24.24 MAccrued compensationAccrued compensation$21.41 MInventoriesInventories$19.33 MLong-term debt due within one yearLong-term debt due within one year$4.70 MNon-current assetsNon-current assets$7.22 BNon-current liabilitiesNon-current liabilities$4.29 BLong-term debtLong-term debt$2.57 BNet property, plant and equipmentNet property, plant and equipment$6.06 BRegulatory liabilitiesRegulatory liabilities$478.41 MEquityEquity$2.93 BDeferred income taxesDeferred income taxes$454.15 MAsset retirement obligationsAsset retirement obligations$441.05 MGoodwillGoodwill$345.74 MOtherOther$185.62 MRegulatory assetsRegulatory assets$295.87 MEnvironmental obligationsEnvironmental obligations$153.74 MGross equity (calculated)Gross equity(calculated)$2.94 BOtherOther$232.19 MOther paid-in capitalOther paid-in capital$1.58 BEnvironmental allowancesEnvironmental allowances$162.15 MRetained earningsRetained earnings$1.15 BInvestmentsInvestments$123.14 MCommon stock Authorized - 500,000,000 shares, $1.00 par value Shares issued - 210,349,456 at June 30, 2026, 204,331,170 at June 30, 2025 and 204,382,821 at December 31, 2025Common stock Authorized$210.35 MAccumulated other comprehensive lossAccumulated other comprehensive loss−$16.45 M
Chart details

MDU RESOURCES GROUP, INC. (MDU) FY2026 Q2 Balance Sheet

Balance sheet as of 2026-06-30. The chart shows assets, liabilities and equity at that date.

Assets
7,712,074,000 US dollars
Current assets
495,975,000 US dollars
Non-current assets
7,216,099,000 US dollars
Liabilities (calculated)
4,785,152,000 US dollars
Current liabilities
499,731,000 US dollars
Non-current liabilities
4,285,421,000 US dollars
Equity
2,926,922,000 US dollars
Property, plant and equipment
8,408,615,000 US dollars. Part of Net property, plant and equipment, drawn as one net amount.
Less accumulated depreciation and amortization
negative 2,351,592,000 US dollars. Part of Net property, plant and equipment, drawn as one net amount.
Current regulatory assets
192,794,000 US dollars
Receivables, net
151,694,000 US dollars
Prepayments and other current assets
61,646,000 US dollars
Cash, cash equivalents and restricted cash
46,269,000 US dollars
Current environmental allowances
24,242,000 US dollars
Inventories
19,330,000 US dollars
Net property, plant and equipment
6,057,023,000 US dollars
Goodwill
345,736,000 US dollars
Regulatory assets
295,865,000 US dollars
Other
232,187,000 US dollars
Environmental allowances
162,151,000 US dollars
Investments
123,137,000 US dollars
Regulatory liabilities due within one year
156,951,000 US dollars
Other accrued liabilities
118,035,000 US dollars
Accounts payable
110,742,000 US dollars
Taxes payable
34,359,000 US dollars
Dividends payable
29,449,000 US dollars
Current environmental obligations
24,086,000 US dollars
Accrued compensation
21,409,000 US dollars
Long-term debt due within one year
4,700,000 US dollars
Long-term debt
2,572,457,000 US dollars
Regulatory liabilities
478,405,000 US dollars
Deferred income taxes
454,147,000 US dollars
Asset retirement obligations
441,048,000 US dollars
Other
185,623,000 US dollars
Environmental obligations
153,741,000 US dollars
Other paid-in capital
1,580,599,000 US dollars
Retained earnings
1,152,426,000 US dollars
Common stock Authorized - 500,000,000 shares, $1.00 par value Shares issued - 210,349,456 at June 30, 2026, 204,331,170 at June 30, 2025 and 204,382,821 at December 31, 2025
210,349,000 US dollars
Accumulated other comprehensive loss
negative 16,452,000 US dollars
Gross equity (calculated)
2,943,374,000 US dollars. Net equity plus the magnitudes of its negative contributions equals gross positive equity. The negative contributions enter this reconciliation as add-backs; their filed signs stay negative.

Chart connections

  • Assets equal liabilities plus consolidated equity. Consolidated equity includes noncontrolling interests when reported.
  • Treasury shares and other negative equity contributions reduce equity.
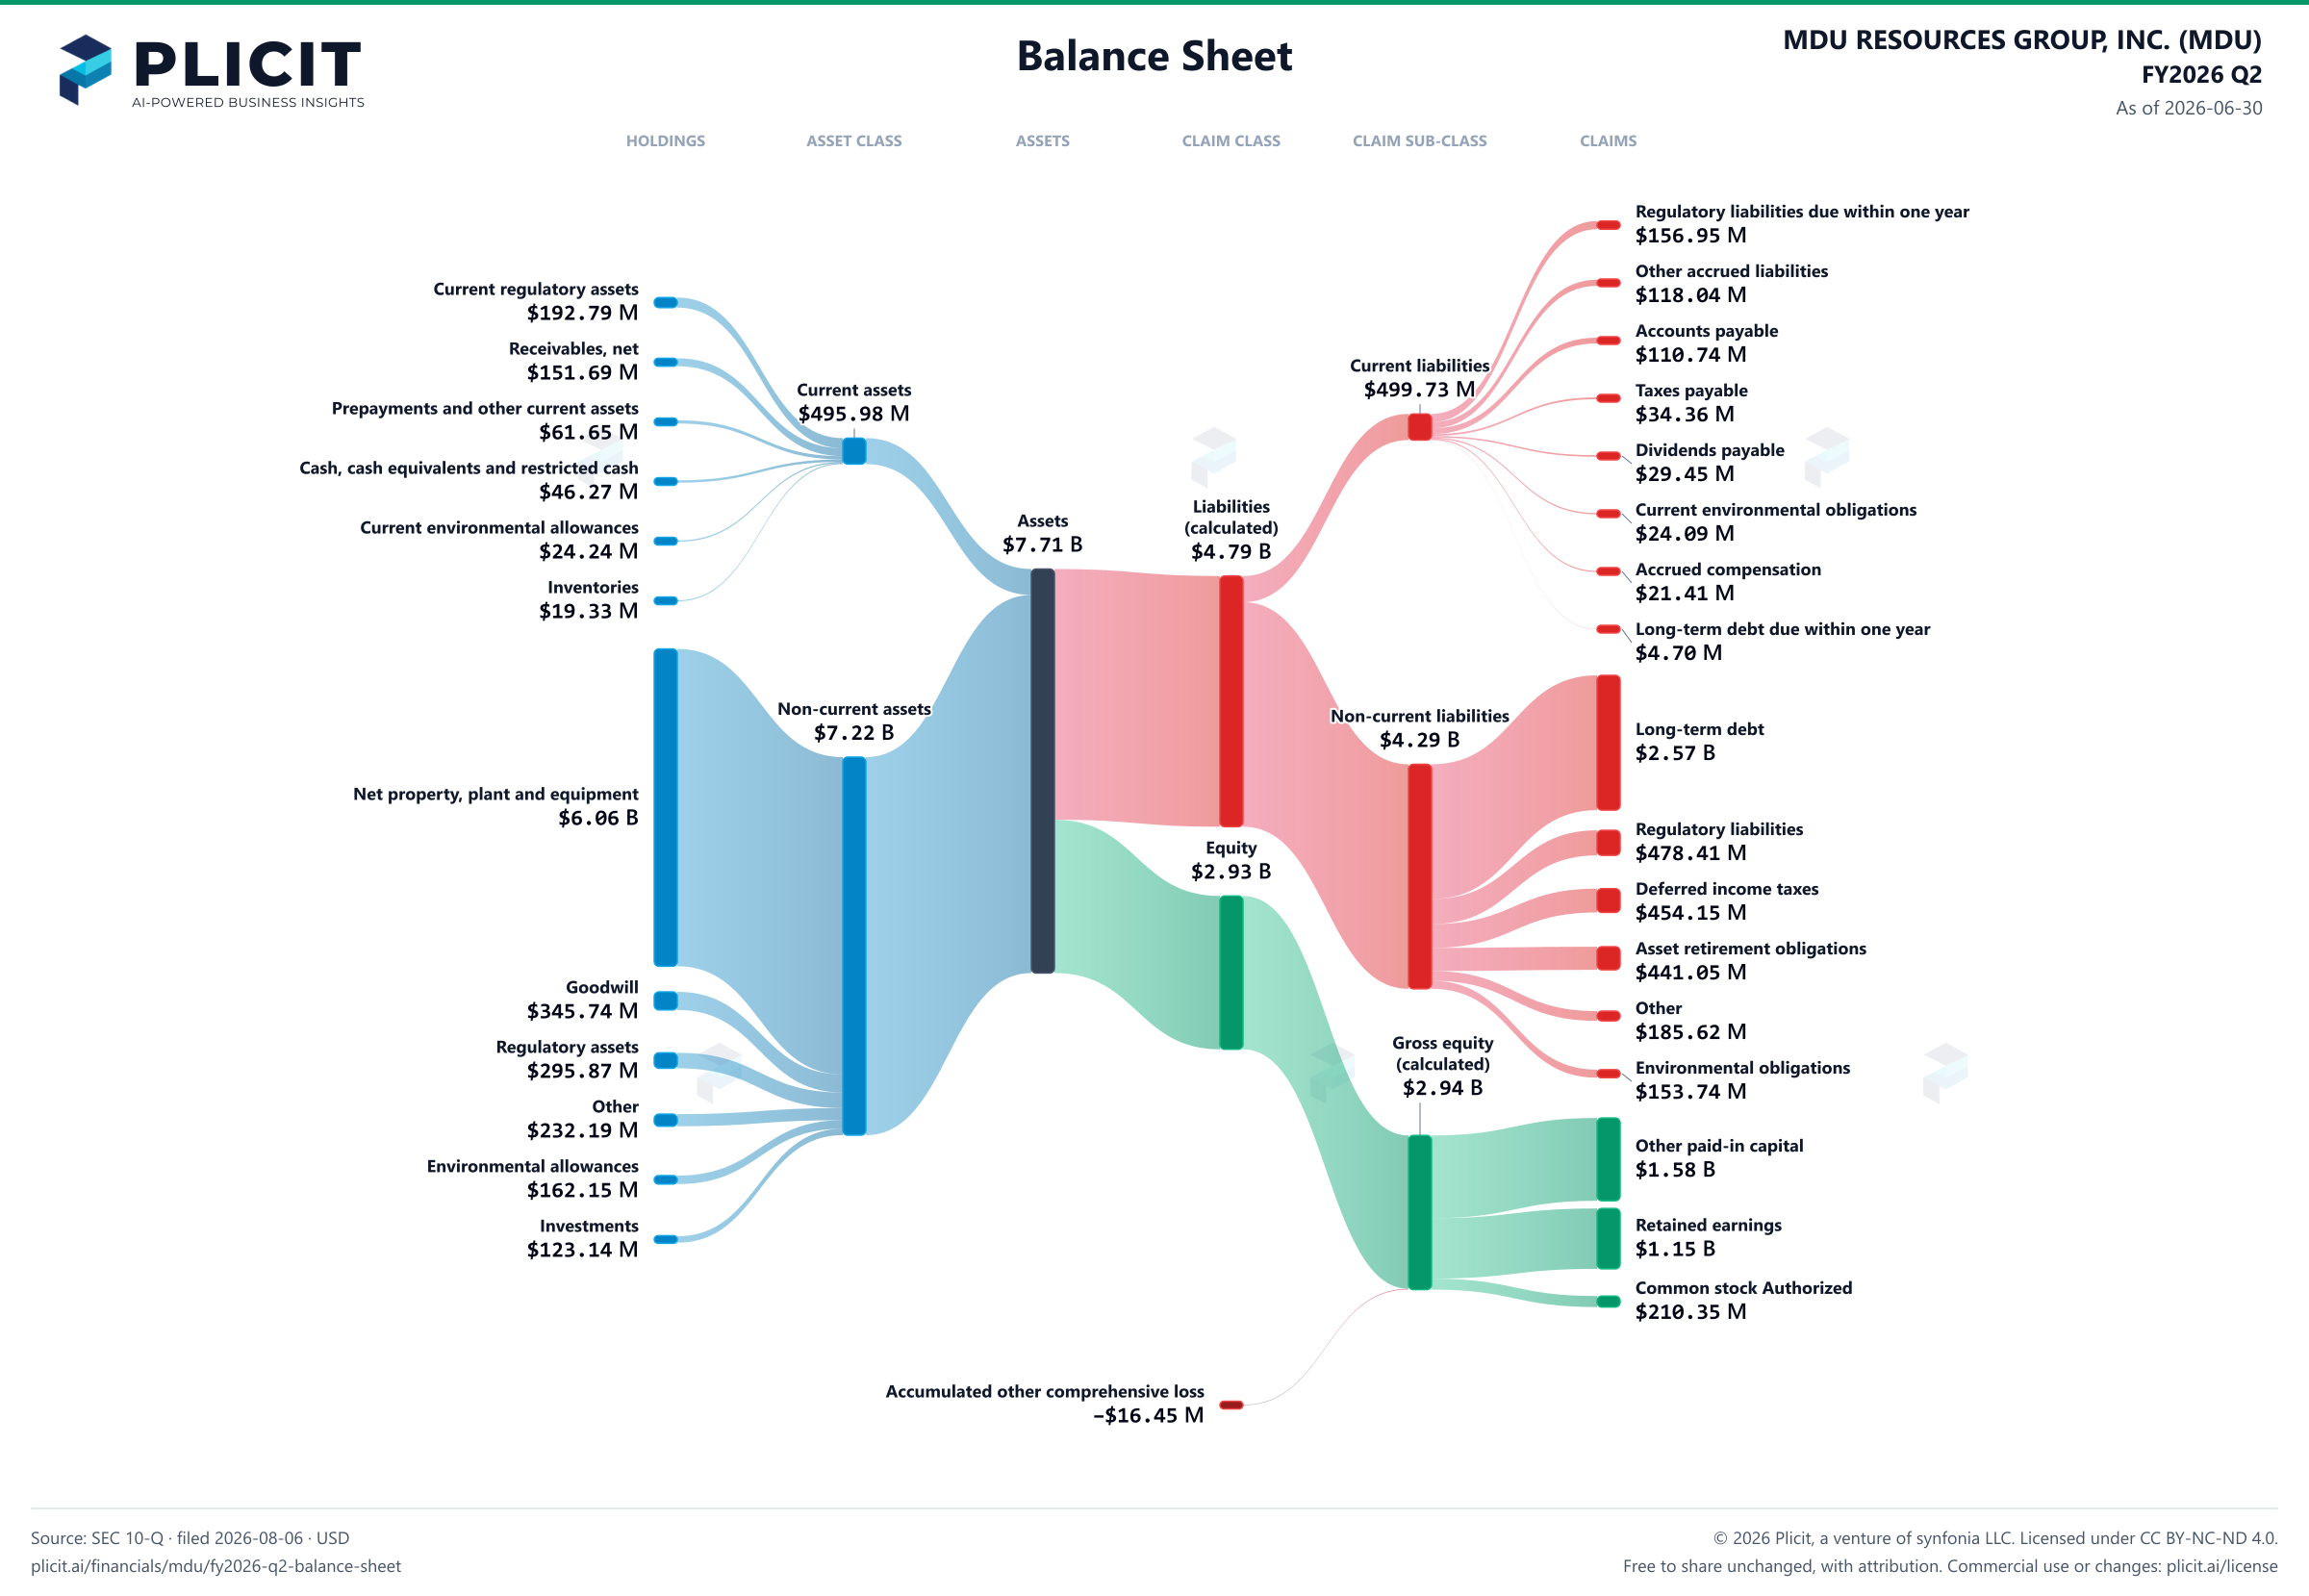
MDU RESOURCES GROUP, INC. (MDU) FY2026 Q2 Balance Sheet Sankey chart
Free to share unchanged, with credit to Plicit.ai · CC BY-NC-ND 4.0Download PNG

Newsletter

Get the teardowns by email

Subscribe if you want the public-company teardowns in your inbox when they're released.

Product waitlist

Health Check and Teardown for your own company

A health check uncovers insights of your private books, not a public ticker. Join this list to get notified as soon as we go-live!