
MercadoLibre, Inc. (MELI) FY2025 Annual Balance Sheet
As of 2025-12-31
Balance Sheet
As of 2025-12-31
Swipe to see the full flow
Chart details
MercadoLibre, Inc. (MELI) FY2025 Annual Balance Sheet
Balance sheet as of 2025-12-31. The chart shows assets, liabilities and equity at that date.
- Assets
- 42,667,000,000 US dollars
- Current assets
- 33,573,000,000 US dollars
- Non-current assets
- 9,094,000,000 US dollars
- Liabilities
- 35,919,000,000 US dollars
- Current liabilities
- 28,633,000,000 US dollars
- Non-current liabilities
- 7,286,000,000 US dollars
- Equity
- 6,748,000,000 US dollars
- Restricted cash and cash equivalents
- 9,867,000,000 US dollars
- Loans receivable, net of allowances of $3,057 and $1,630 (Note 5)
- 8,855,000,000 US dollars
- Credit card receivables and other means of payments, net
- 6,893,000,000 US dollars
- Cash and cash equivalents
- 3,670,000,000 US dollars
- Short-term investments
- 2,629,000,000 US dollars
- Other assets
- 720,000,000 US dollars
- Inventories
- 570,000,000 US dollars
- Accounts receivable, net
- 369,000,000 US dollars
- Property and equipment, net
- 2,303,000,000 US dollars
- Operating lease right-of-use assets
- 2,201,000,000 US dollars
- Long-term investments
- 1,764,000,000 US dollars
- Deferred tax assets
- 1,541,000,000 US dollars
- Loans receivable, net of allowances of $86 and $48 (Note 5)
- 510,000,000 US dollars
- Other assets
- 426,000,000 US dollars
- Goodwill
- 163,000,000 US dollars
- Credit card receivables and other means of payments, net
- 153,000,000 US dollars
- Intangible assets, net
- 33,000,000 US dollars
- Intangible assets at fair value
- 0 US dollars
- Funds payable to customers
- 13,029,000,000 US dollars
- Loans payable and other financial liabilities
- 4,623,000,000 US dollars
- Accounts payable and accrued expenses
- 4,502,000,000 US dollars
- Amounts payable due to credit and debit card transactions
- 3,584,000,000 US dollars
- Taxes payable
- 1,140,000,000 US dollars
- Salaries and social security payable
- 916,000,000 US dollars
- Operating lease liabilities
- 430,000,000 US dollars
- Other liabilities
- 409,000,000 US dollars
- Loans payable and other financial liabilities
- 4,570,000,000 US dollars
- Operating lease liabilities
- 1,769,000,000 US dollars
- Other liabilities
- 388,000,000 US dollars
- Deferred tax liabilities
- 372,000,000 US dollars
- Amounts payable due to credit and debit card transactions
- 187,000,000 US dollars
- Retained earnings
- 5,809,000,000 US dollars
- Additional paid-in capital
- 1,771,000,000 US dollars
- Common stock, 0.001 par value, $110,000,000 shares authorized, $50,697,182 and $50,697,375 shares issued and outstanding
- 0 US dollars
- Accumulated other comprehensive loss
- negative 520,000,000 US dollars
- Treasury stock, 225,931 and 225,474 shares
- negative 312,000,000 US dollars
- Gross equity (calculated)
- 7,580,000,000 US dollars. Net equity plus the magnitudes of its negative contributions equals gross positive equity. The negative contributions enter this reconciliation as add-backs; their filed signs stay negative.
Chart connections
- Assets equal liabilities plus consolidated equity. Consolidated equity includes noncontrolling interests when reported.
- Treasury shares and other negative equity contributions reduce equity.
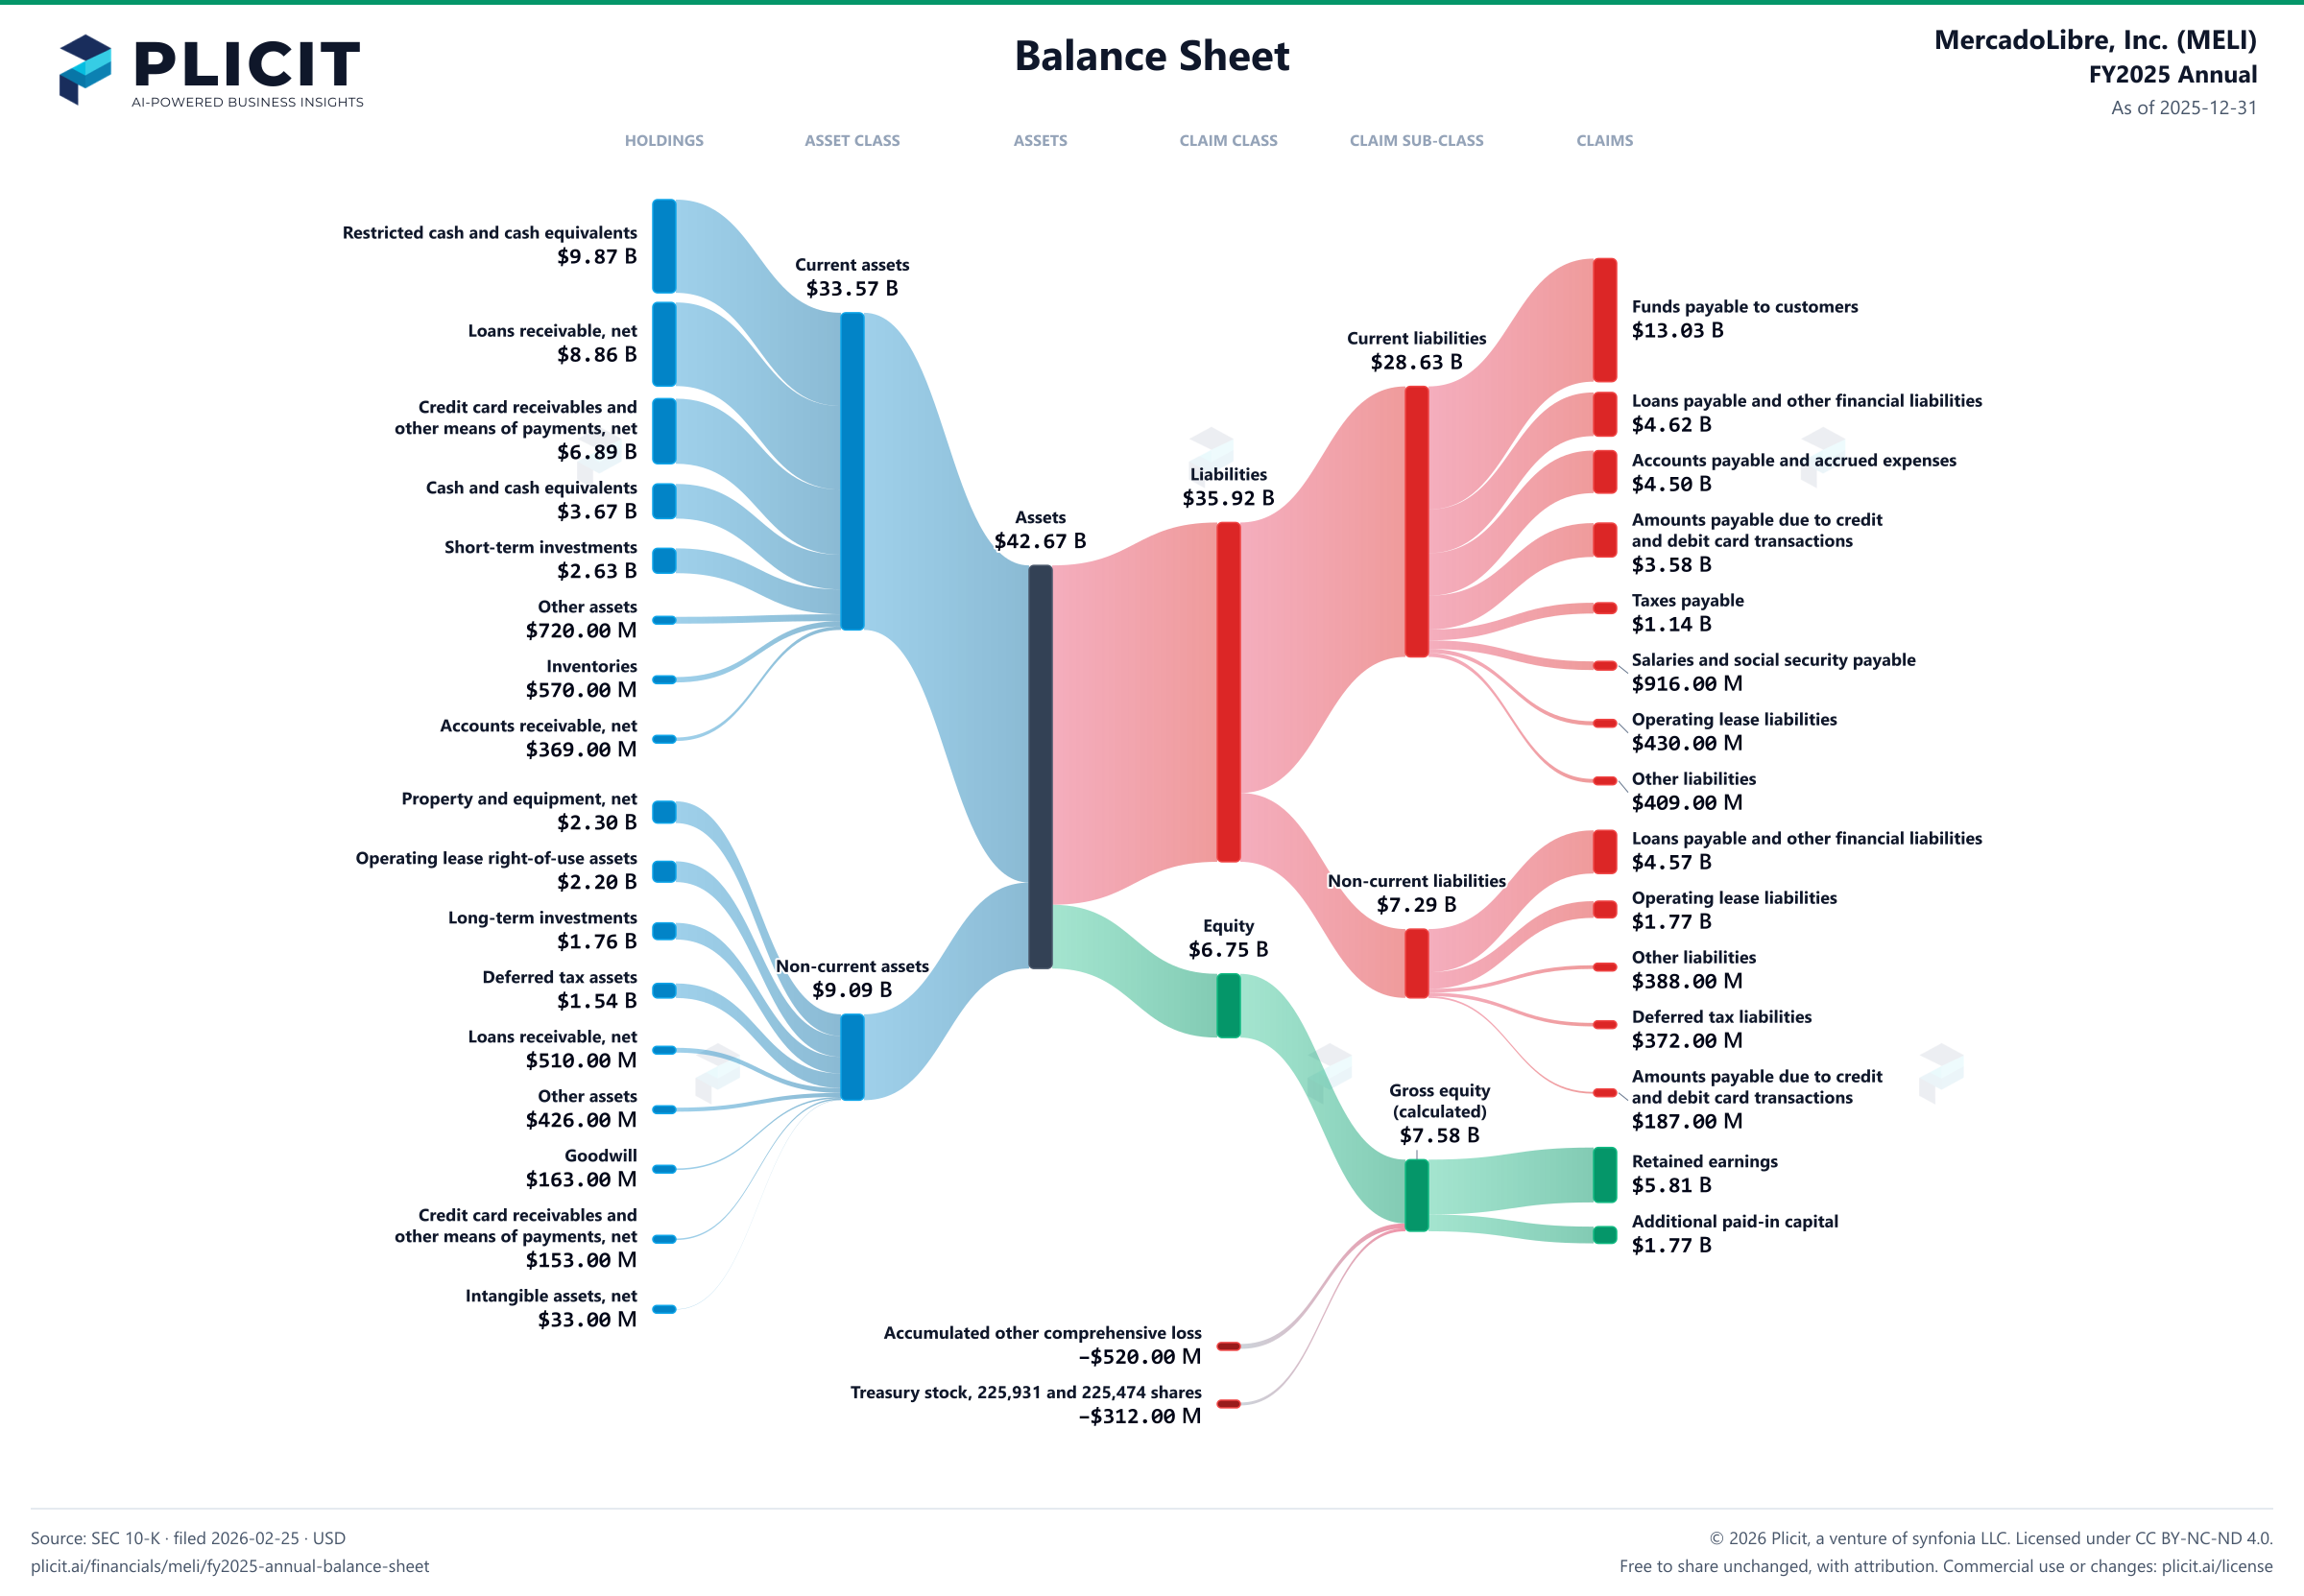
Free to share unchanged, with credit to Plicit.ai · CC BY-NC-ND 4.0Download PNG
Product waitlist
Health Check and Teardown for your own company
A health check uncovers insights of your private books, not a public ticker. Join this list to get notified as soon as we go-live!