
THE MIDDLEBY CORPORATION (MIDD) FY2026 Q2 Balance Sheet
As of 2026-07-04
Balance Sheet
As of 2026-07-04
Swipe to see the full flow
Chart details
THE MIDDLEBY CORPORATION (MIDD) FY2026 Q2 Balance Sheet
Balance sheet as of 2026-07-04. The chart shows assets, liabilities and equity at that date.
- Assets
- 5,360,653,000 US dollars
- Current assets
- 1,643,808,000 US dollars
- Non-current assets
- 3,716,845,000 US dollars
- Liabilities (calculated)
- 3,150,699,000 US dollars
- Current liabilities
- 827,287,000 US dollars
- Non-current liabilities
- 2,323,412,000 US dollars
- Equity
- 2,209,954,000 US dollars
- Inventories, net
- 737,633,000 US dollars
- Accounts receivable, net of allowances for credit losses of $24,829 and $25,001
- 601,178,000 US dollars
- Cash and cash equivalents
- 159,178,000 US dollars
- Prepaid expenses and other
- 111,222,000 US dollars
- Prepaid Taxes
- 22,761,000 US dollars
- Disposal Group, Including Discontinued Operation, Assets, Current
- 11,836,000 US dollars
- Goodwill
- 1,794,299,000 US dollars
- Other intangibles, net of accumulated amortization of $585,437 and $564,224
- 1,030,987,000 US dollars
- Property, plant and equipment, net of accumulated depreciation of $335,984 and $311,226
- 423,052,000 US dollars
- Other assets
- 152,940,000 US dollars
- Assets for Plan Benefits, Defined Benefit Plan
- 112,235,000 US dollars
- Equity Method Investments
- 109,724,000 US dollars
- Accounts and Financing Receivable, after Allowance for Credit Loss, Noncurrent
- 86,879,000 US dollars
- Long-term deferred tax assets
- 6,729,000 US dollars
- Accrued expenses
- 549,383,000 US dollars
- Accounts payable
- 224,281,000 US dollars
- Current maturities of long-term debt
- 44,101,000 US dollars
- Disposal Group, Including Discontinued Operation, Liabilities, Current
- 9,522,000 US dollars
- Long-term debt
- 1,935,423,000 US dollars
- Deferred Income Tax Liabilities, Net
- 212,184,000 US dollars
- Other non-current liabilities
- 168,497,000 US dollars
- Liability, Defined Benefit Pension Plan, Noncurrent
- 7,308,000 US dollars
- Cumulative Effect Period of Adoptions ASU 2020-06, Retained earnings
- 4,055,195,000 US dollars
- Cumulative Effect Period of Adoption ASU 2020-06, Paid-in capital
- 618,767,000 US dollars
- Common stock, $0.01 par value; 65,119,985 and 64,964,586 shares issued
- 153,000 US dollars
- Preferred stock, $0.01 par value; nonvoting; 2,000,000 shares authorized; none issued
- 0 US dollars
- Treasury stock, at cost; 19,897,564 and 16,041,990 shares
- negative 2,316,646,000 US dollars
- Accumulated other comprehensive loss
- negative 147,515,000 US dollars
- Gross equity (calculated)
- 4,674,115,000 US dollars. Net equity plus the magnitudes of its negative contributions equals gross positive equity. The negative contributions enter this reconciliation as add-backs; their filed signs stay negative.
Chart connections
- Assets equal liabilities plus consolidated equity. Consolidated equity includes noncontrolling interests when reported.
- Treasury shares and other negative equity contributions reduce equity.
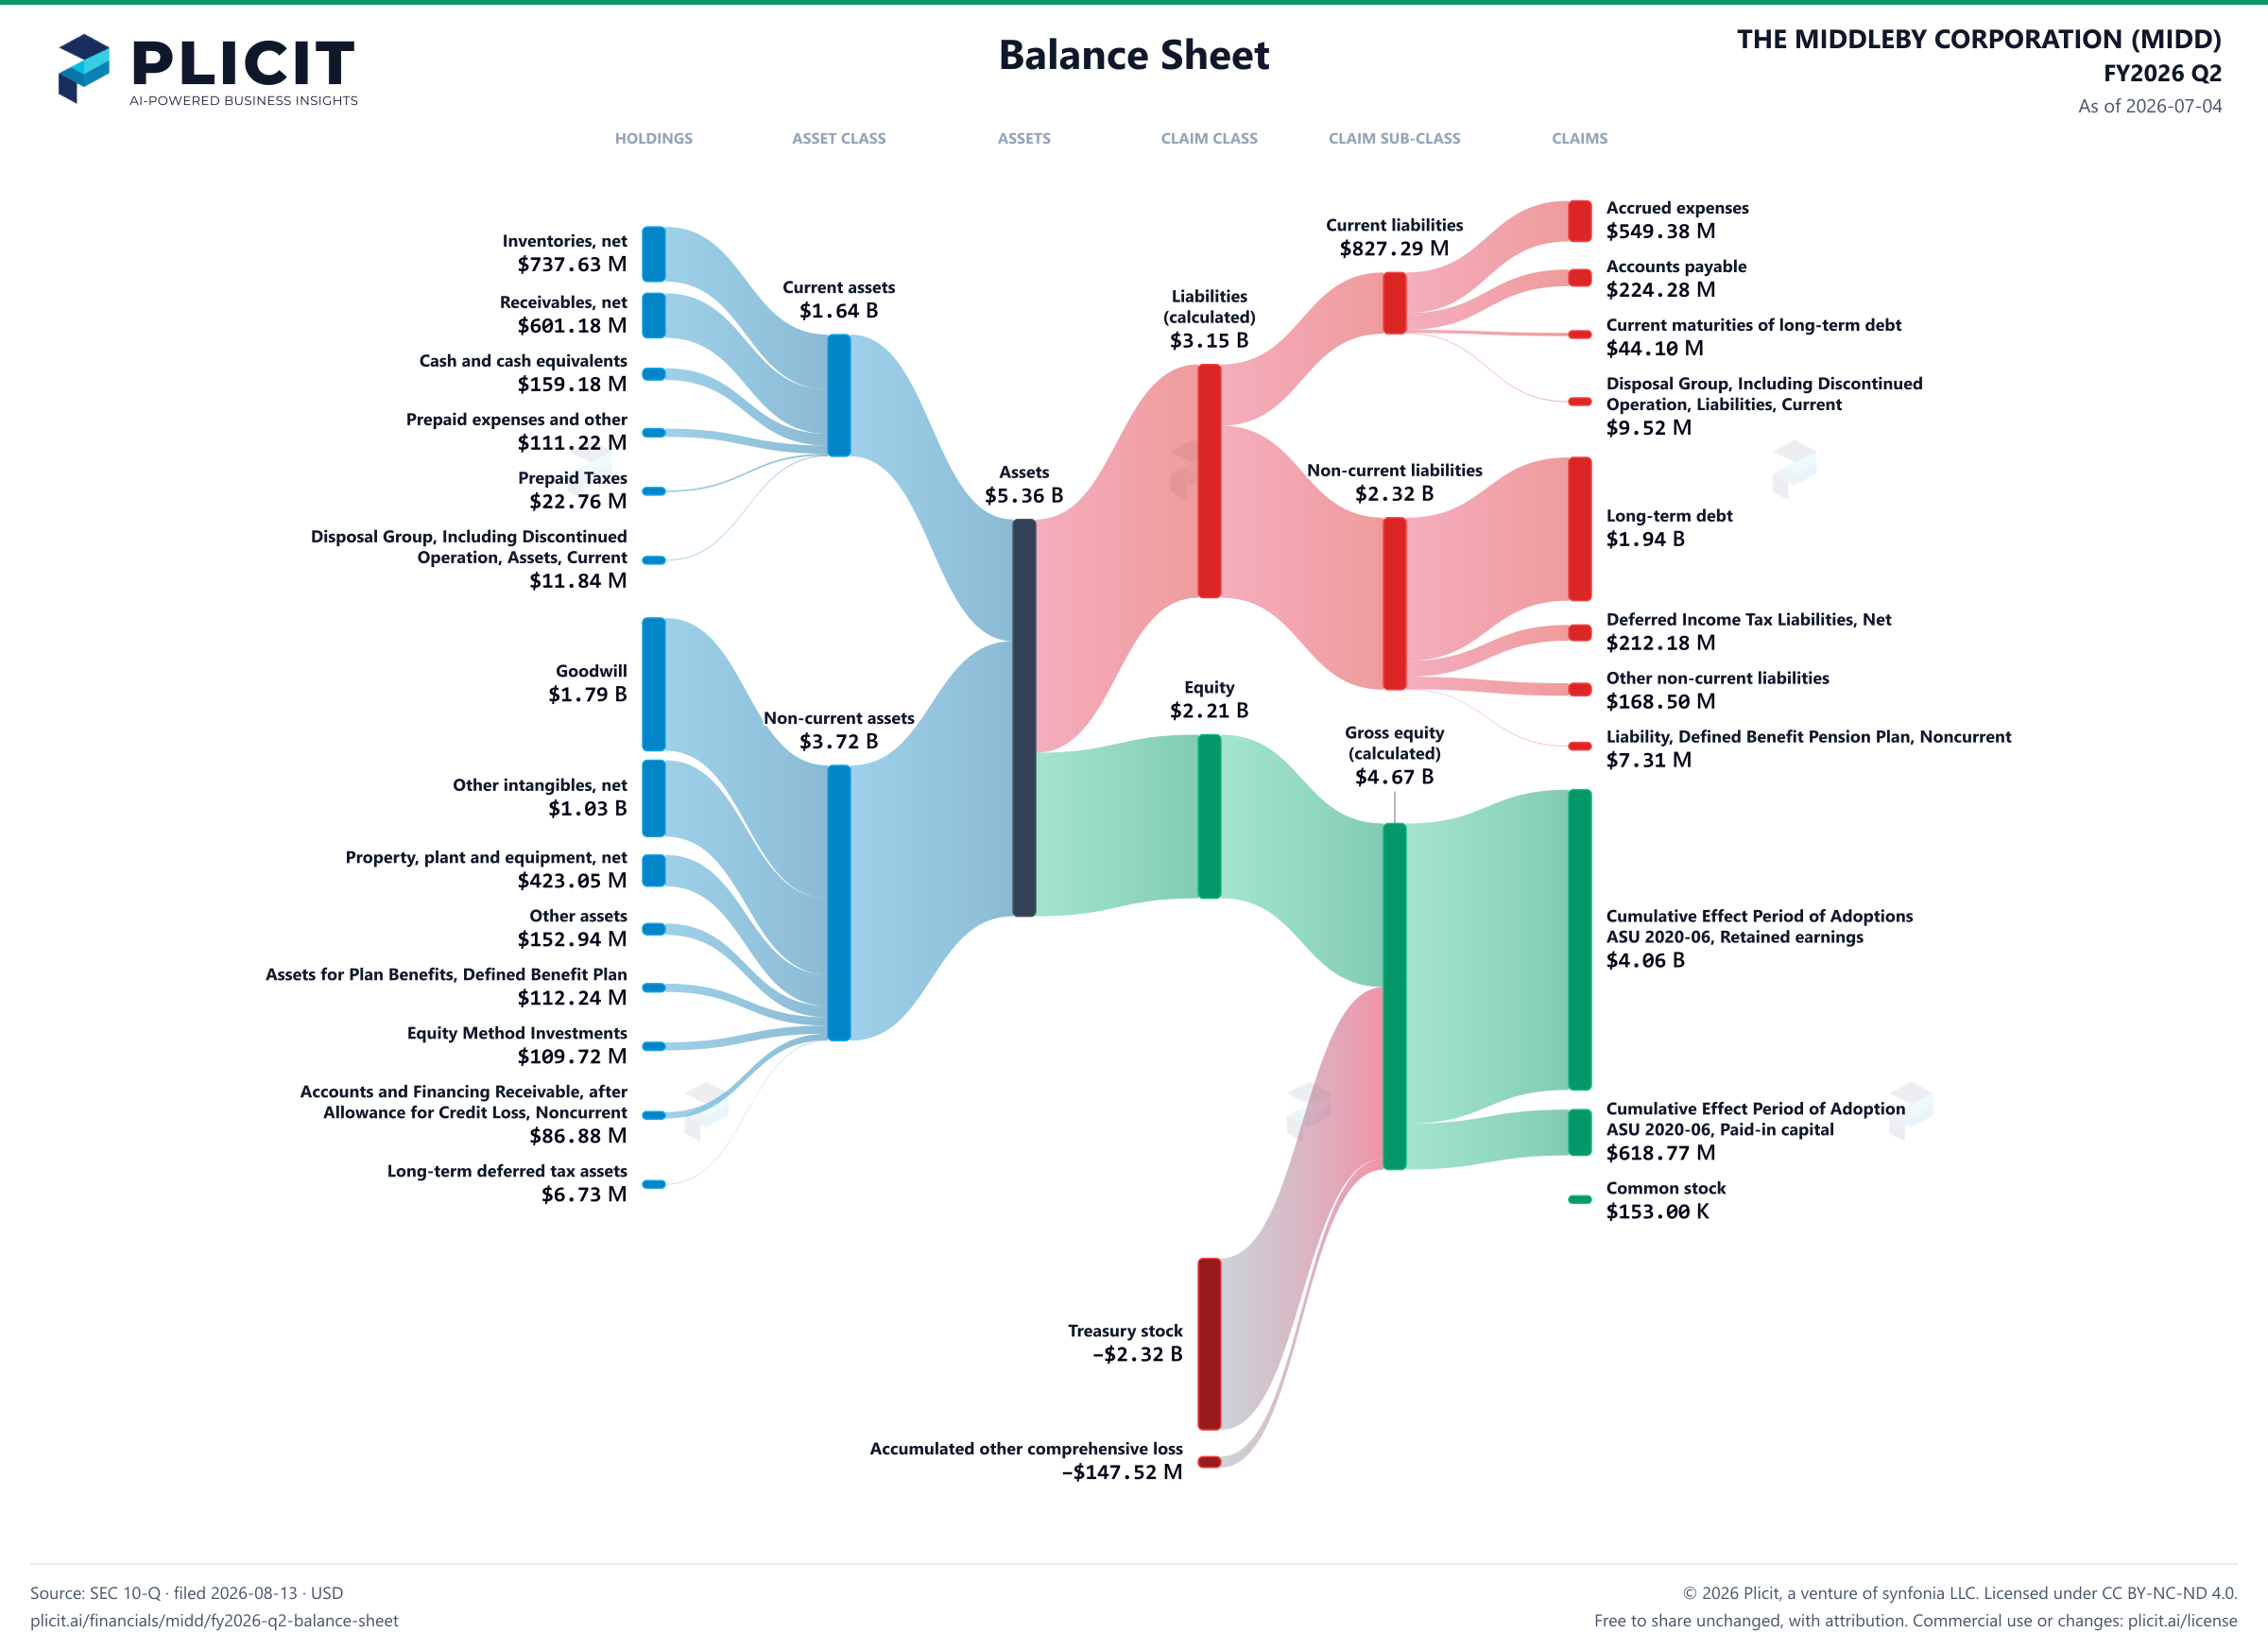
Free to share unchanged, with credit to Plicit.ai · CC BY-NC-ND 4.0Download PNG
Product waitlist
Health Check and Teardown for your own company
A health check uncovers insights of your private books, not a public ticker. Join this list to get notified as soon as we go-live!