
MUELLER INDUSTRIES, INC (MLI) FY2026 Q3 Balance Sheet

Published Source: Form 10-Q on SEC EDGAR filed (opens in a new tab)

As of 2026-09-26

Balance Sheet

Swipe to see the full flow
MUELLER INDUSTRIES, INC (MLI) FY2026 Q3 Balance SheetBalance sheet as of 2026-09-26. The chart shows assets, liabilities and equity at that date.Current liabilities$655.59 MLiabilities$755.28 MCurrent assets$2.88 BNon-current liabilities$99.68 MAssets$4.30 BEquity$3.54 BNon-current assets$1.42 BHOLDINGSASSET CLASSASSETSCLAIM CLASSCLAIM SUB-CLASSCLAIMSCash and cash equivalentsAccounts receivable, less allowance for credit losses of $3,596 in 2026 and $2,545 in 2025InventoriesOther current assetsShort-term investmentsProperty, plant, and equipment, netIntangible assets, netGoodwill, netInvestments in unconsolidated affiliatesOther assetsOperating lease right-of-use assetsAccounts payableOther current liabilitiesAccrued wages and other employee costsCurrent portion of operating lease liabilitiesDeferred income taxesEnvironmental reservesNoncurrent operating lease liabilitiesOther noncurrent liabilitiesPostretirement benefits other than pensionsLong-term debt, less current portionPension liabilitiesRetained earningsAdditional paid-in capitalNoncontrolling interestsCommon stock - $.01 par value; shares authorized 500,000,000 in 2026 and 250,000,000 in 2025; issued 320,732,016; outstanding 110,562,284 in 2026 and 222,359,500 in 2025Treasury common stock, at costAccumulated other comprehensive lossCurrent assetsNon-current assetsAssetsCurrent liabilitiesNon-current liabilitiesLiabilitiesEquityEquityAccounts payableAccounts payable$297.92 MCurrent liabilitiesCurrent liabilities$655.59 MOther current liabilitiesOther current liabilities$295.99 MAccrued wages and other employee costsAccrued wages and other employee costs$53.49 MCurrent portion of operating lease liabilitiesCurrent portion of operating lease liabilities$8.18 MCash and cash equivalentsCash and cash equivalents$1.45 BLiabilitiesLiabilities$755.28 MCurrent assetsCurrent assets$2.88 BDeferred income taxesDeferred income taxes$46.35 MEnvironmental reservesEnvironmental reserves$15.76 MAccounts receivable, less allowance for credit losses of $3,596 in 2026 and $2,545 in 2025Accounts receivable, net$723.99 MNoncurrent operating lease liabilitiesNoncurrent operating lease liabilities$13.10 MNon-current liabilitiesNon-current liabilities$99.68 MInventoriesInventories$621.39 MOther noncurrent liabilitiesOther noncurrent liabilities$10.49 MAssetsAssets$4.30 BOther current assetsOther current assets$53.22 MPostretirement benefits other than pensionsPostretirement benefits other than pensions$8.14 MShort-term investmentsShort-term investments$33.10 MLong-term debt, less current portionLong-term debt, less current portion$5.24 MPension liabilitiesPension liabilities$605.00 KEquityEquity$3.54 BProperty, plant, and equipment, netProperty, plant, and equipment, net$602.79 MIntangible assets, netIntangible assets, net$342.67 MNon-current assetsNon-current assets$1.42 BGoodwill, netGoodwill, net$308.33 MRetained earningsRetained earnings$4.36 BInvestments in unconsolidated affiliatesInvestments in unconsolidated affiliates$109.31 MOther assetsOther assets$33.93 MAdditional paid-in capitalAdditional paid-in capital$362.74 MOperating lease right-of-use assetsOperating lease right-of-use assets$21.07 MNoncontrolling interestsNoncontrolling interests$30.87 MCommon stock - $.01 par value; shares authorized 500,000,000 in 2026 and 250,000,000 in 2025; issued 320,732,016; outstanding 110,562,284 in 2026 and 222,359,500 in 2025Common stock$3.21 MTreasury common stock, at costBought back (treasury stock)−$1.15 BAccumulated other comprehensive lossOther comprehensive loss−$60.53 M
Chart details

MUELLER INDUSTRIES, INC (MLI) FY2026 Q3 Balance Sheet

Balance sheet as of 2026-09-26. The chart shows assets, liabilities and equity at that date.

Assets
4,297,594,000 US dollars
Current assets
2,879,497,000 US dollars
Non-current assets
1,418,097,000 US dollars
Liabilities
755,276,000 US dollars
Current liabilities
655,592,000 US dollars
Non-current liabilities
99,684,000 US dollars
Equity
3,542,318,000 US dollars
Noncontrolling interest
30,867,000 US dollars. Included in consolidated equity; this amount is not added again.
Cash and cash equivalents
1,447,799,000 US dollars
Accounts receivable, less allowance for credit losses of $3,596 in 2026 and $2,545 in 2025
723,993,000 US dollars
Inventories
621,390,000 US dollars
Other current assets
53,215,000 US dollars
Short-term investments
33,100,000 US dollars
Property, plant, and equipment, net
602,787,000 US dollars
Intangible assets, net
342,674,000 US dollars
Goodwill, net
308,325,000 US dollars
Investments in unconsolidated affiliates
109,311,000 US dollars
Other assets
33,934,000 US dollars
Operating lease right-of-use assets
21,066,000 US dollars
Accounts payable
297,923,000 US dollars
Other current liabilities
295,994,000 US dollars
Accrued wages and other employee costs
53,494,000 US dollars
Current portion of operating lease liabilities
8,181,000 US dollars
Deferred income taxes
46,345,000 US dollars
Environmental reserves
15,758,000 US dollars
Noncurrent operating lease liabilities
13,097,000 US dollars
Other noncurrent liabilities
10,493,000 US dollars
Postretirement benefits other than pensions
8,143,000 US dollars
Long-term debt, less current portion
5,243,000 US dollars
Pension liabilities
605,000 US dollars
Commitments and contingencies
0 US dollars
Retained earnings
4,355,779,000 US dollars
Additional paid-in capital
362,735,000 US dollars
Common stock - $.01 par value; shares authorized 500,000,000 in 2026 and 250,000,000 in 2025; issued 320,732,016; outstanding 110,562,284 in 2026 and 222,359,500 in 2025
3,208,000 US dollars
Preferred stock - $1.00 par value; shares authorized 5,000,000; none outstanding
0 US dollars
Noncontrolling interests
30,867,000 US dollars
Treasury common stock, at cost
negative 1,149,741,000 US dollars
Accumulated other comprehensive loss
negative 60,530,000 US dollars

Chart connections

  • Assets equal liabilities plus consolidated equity. Consolidated equity includes noncontrolling interests when reported.
  • Treasury shares and other negative equity contributions reduce equity.
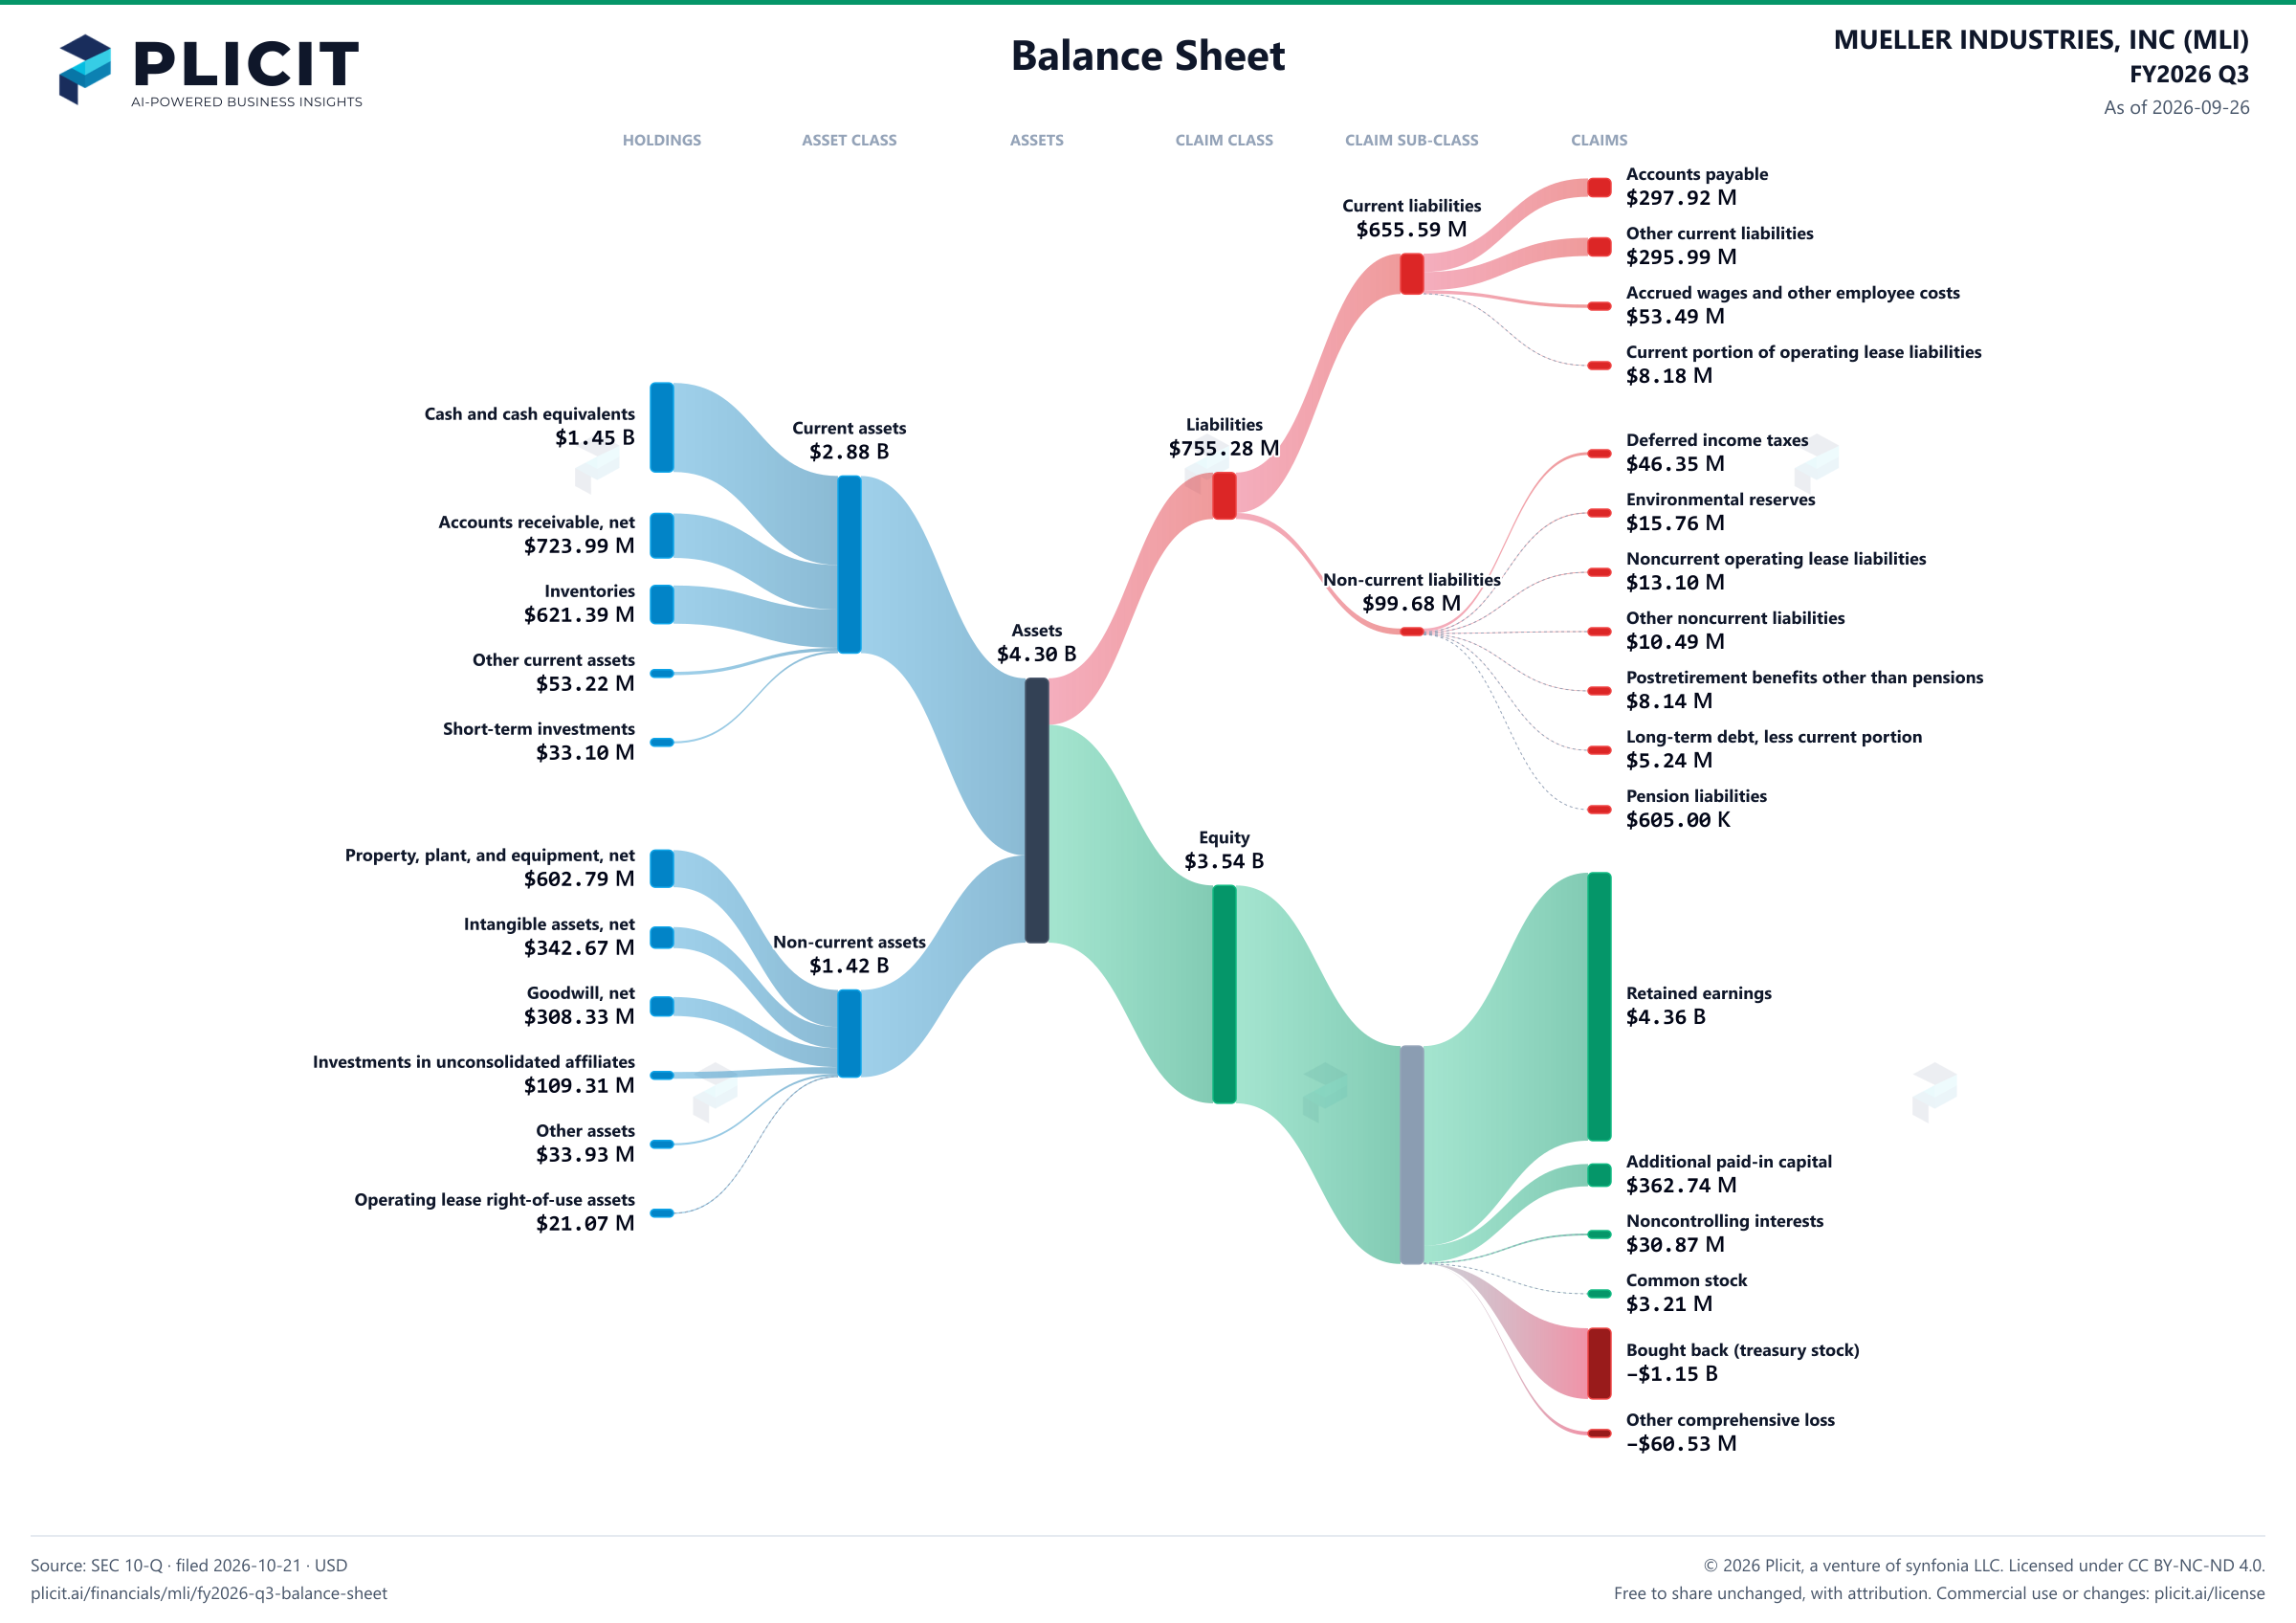
MUELLER INDUSTRIES, INC (MLI) FY2026 Q3 Balance Sheet Sankey chart
Free to share unchanged, with credit to Plicit.ai · CC BY-NC-ND 4.0Download PNG

Product waitlist

Health Check and Teardown for your own company

A health check uncovers insights of your private books, not a public ticker. Join this list to get notified as soon as we go-live!