
MADISON SQUARE GARDEN ENTERTAINMENT CORP. (MSGE) FY2026 Annual P&L / Income Statement

Revenue by Product and Service

2025-07-01 to 2026-06-30

Swipe to see the full flow
MADISON SQUARE GARDEN ENTERTAINMENT CORP. (MSGE) FY2026 Annual P&L / Income StatementIncome statement for 2025-07-01 through 2026-06-30. View: Product and service (Disaggregation of Revenue). Revenue uses this breakdown; costs and expenses retain the consolidated categories.SOURCESREVENUEGROSSOPERATINGPRE-TAXNETTicketing and venue license fee revenuesSponsorship and signage, suite, and advertising commission revenuesFood, beverage, and merchandise revenuesArena license fees and other leasing revenueOtherRevenuesGross profit (calculated)Cost of revenue (calculated)Total direct operating expensesOperating incomeOperating expenses (calculated)Selling, general and administrative expensesDepreciation and amortizationRestructuring chargesImpairment of long-lived assetsIncome from operations before income taxesOther income (expense), net (calculated)Net incomeIncome tax (expense) benefitGross profit (calculated)Gross profit(calculated)$478.49 MIncome from operations before income taxesIncome from operationsbefore income taxes$106.98 MRevenuesRevenues$1.06 BOperating incomeOperating income$141.54 MNet incomeNet income$66.19 MTicketing and venue license fee revenuesTicketing and venuelicense fee revenues$528.35 MOperating expenses (calculated)Operating expenses(calculated)$336.95 MIncome tax (expense) benefitIncome tax(expense) benefit$40.79 MOther income (expense), net (calculated)Other income,net (calculated)−$34.56 MSelling, general and administrative expensesSelling, general andadministrative expenses$253.11 MCost of revenue (calculated)Cost of revenue(calculated)$582.30 MSponsorship and signage, suite, and advertising commission revenuesSponsorship and signage, suite, andadvertising commission revenues$275.49 MDepreciation and amortizationDepreciation and amortization$56.07 MFood, beverage, and merchandise revenuesFood, beverage, andmerchandise revenues$164.41 MRestructuring chargesRestructuring charges$13.99 MImpairment of long-lived assetsImpairment of long-lived assets$13.78 MTotal direct operating expensesTotal directoperating expenses$582.30 MArena license fees and other leasing revenueArena license fees andother leasing revenue$86.25 MOtherOther$6.29 M
Chart details

MADISON SQUARE GARDEN ENTERTAINMENT CORP. (MSGE) FY2026 Annual P&L / Income Statement

Income statement for 2025-07-01 through 2026-06-30. View: Product and service (Disaggregation of Revenue). Revenue uses this breakdown; costs and expenses retain the consolidated categories.

Revenues
1,060,784,000 US dollars
Cost of revenue (calculated)
582,299,000 US dollars
Gross profit (calculated)
478,485,000 US dollars
Operating expenses (calculated)
336,949,000 US dollars
Operating income
141,536,000 US dollars
Other income (expense), net (calculated)
negative 34,560,000 US dollars
Income from operations before income taxes
106,976,000 US dollars
Income tax (expense) benefit
40,790,000 US dollars
Net income
66,186,000 US dollars
Ticketing and venue license fee revenues
528,350,000 US dollars
Sponsorship and signage, suite, and advertising commission revenues
275,492,000 US dollars
Other
6,286,000 US dollars
Food, beverage, and merchandise revenues
164,410,000 US dollars
Arena license fees and other leasing revenue
86,246,000 US dollars
Total direct operating expenses
582,299,000 US dollars
Selling, general and administrative expenses
253,112,000 US dollars
Depreciation and amortization
56,069,000 US dollars
Impairment of long-lived assets
13,782,000 US dollars
Restructuring charges
13,986,000 US dollars

Chart connections

  • Revenue less cost of revenue equals gross profit; gross profit less operating expenses equals operating income.
  • Operating income plus other income or expense equals income before tax. Income before tax less income tax expense or benefit equals net income.
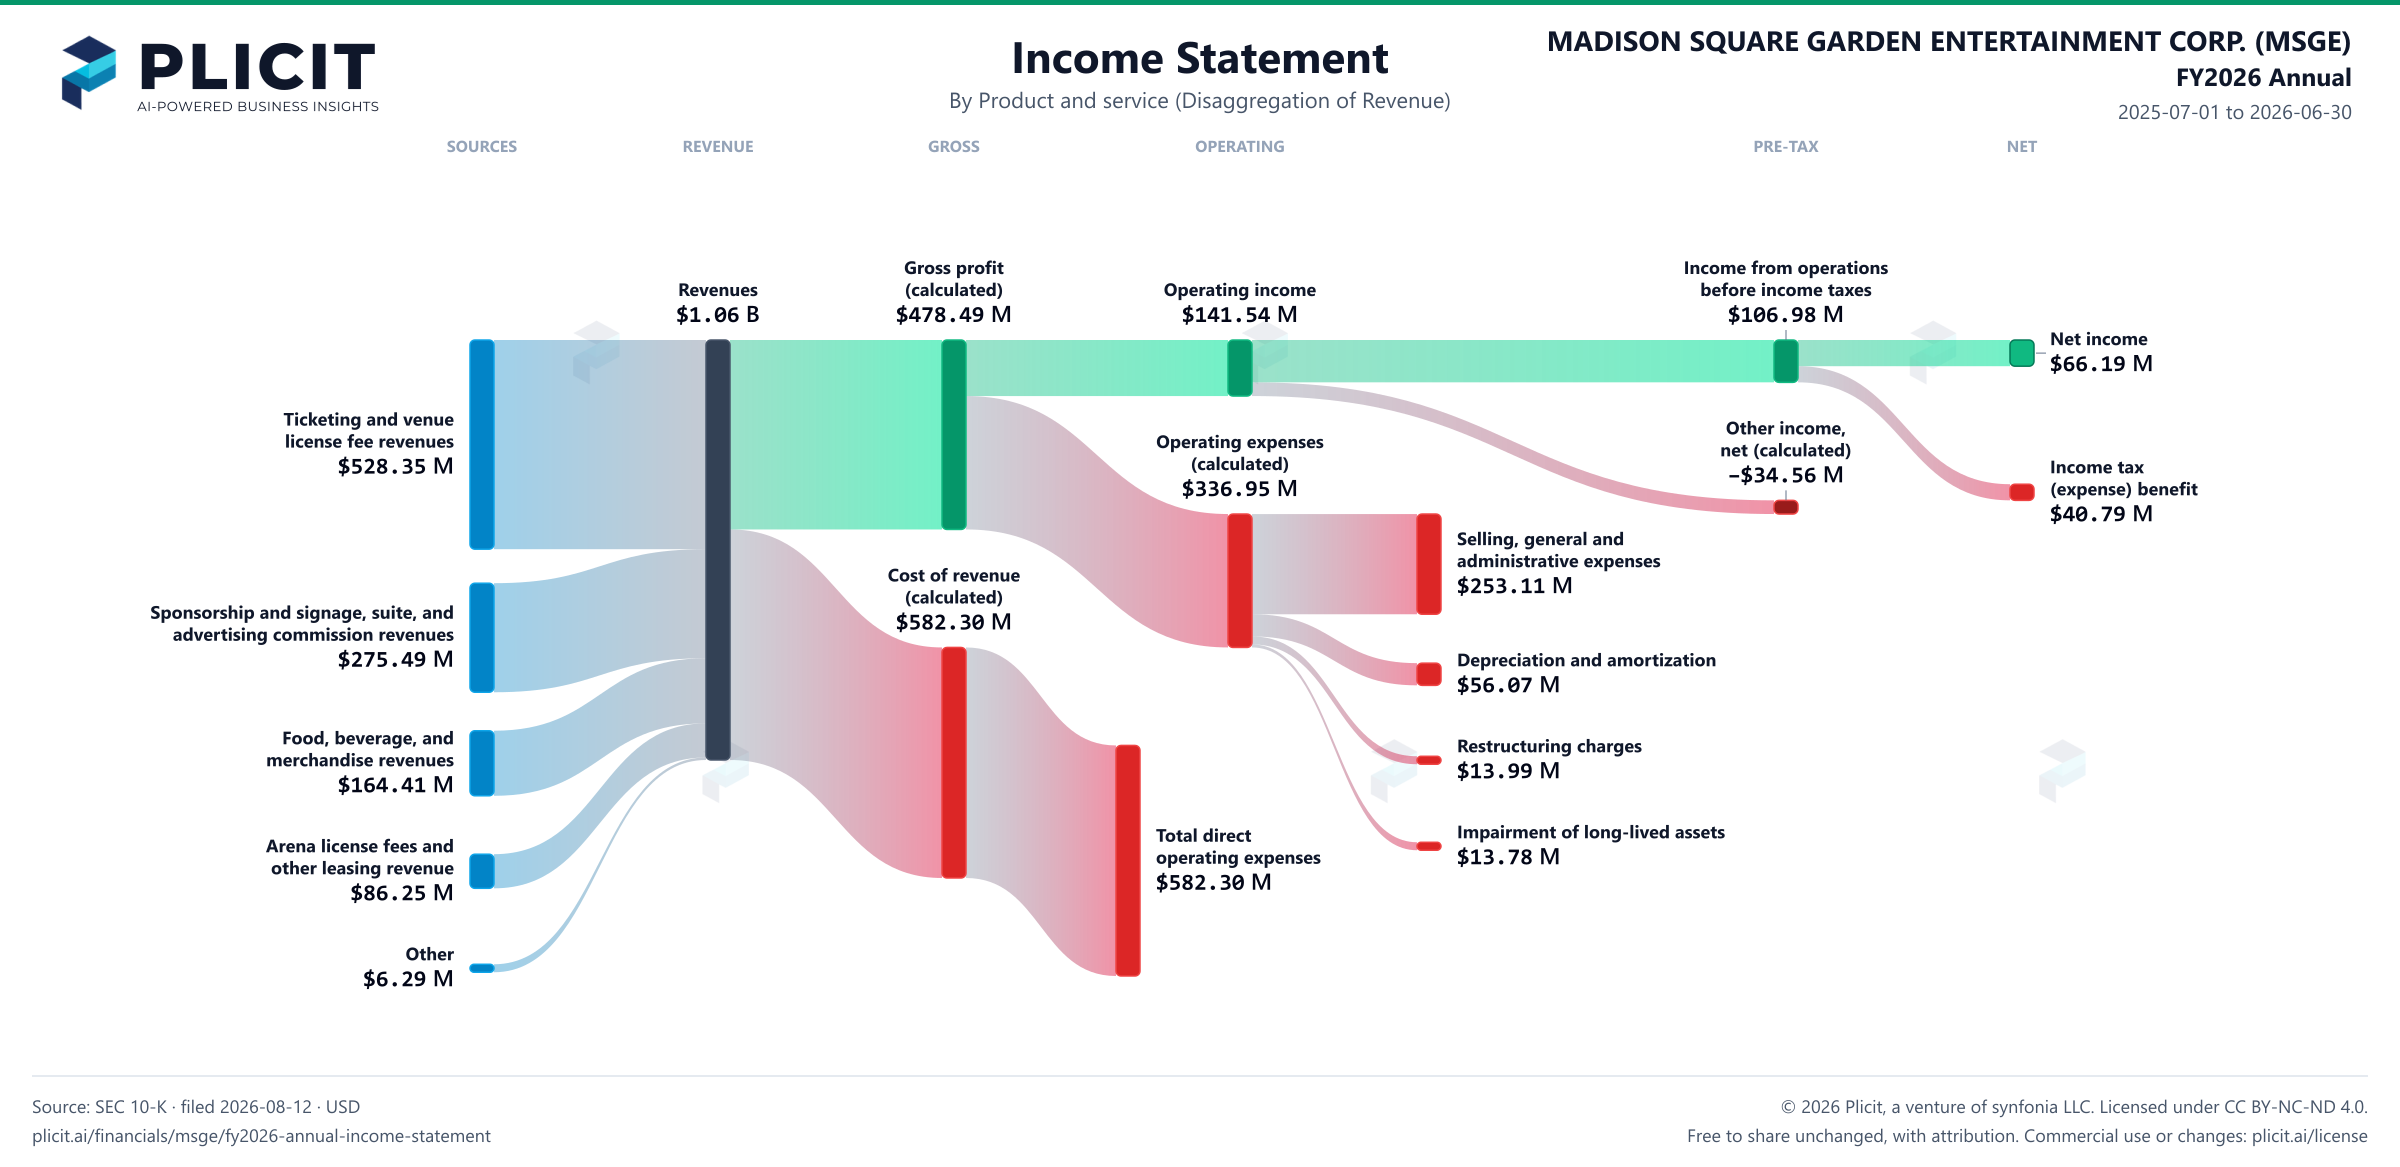
MADISON SQUARE GARDEN ENTERTAINMENT CORP. (MSGE) FY2026 Annual P&L / Income Statement Sankey chart, Product and service (Disaggregation of Revenue) view
Free to share unchanged, with credit to Plicit.ai · CC BY-NC-ND 4.0Download PNG

Gross margin

45.1%

Gross profit / revenue

Operating margin

13.3%

Operating profit / revenue

Cash conversion

531.0%

Operating cash / net income, same period

Newsletter

Get the teardowns by email

Subscribe if you want the public-company teardowns in your inbox when they're released.

Product waitlist

Health Check and Teardown for your own company

A health check uncovers insights of your private books, not a public ticker. Join this list to get notified as soon as we go-live!