
MATERION CORPORATION (MTRN) FY2026 Q2 P&L / Income Statement

Revenue by Business Segment by Product and Service

2026-04-04 to 2026-07-03

Swipe to see the full flow
MATERION CORPORATION (MTRN) FY2026 Q2 P&L / Income StatementIncome statement for 2026-04-04 through 2026-07-03. View: Segments by Product and Service. Revenue uses this breakdown; costs and expenses retain the consolidated categories.SOURCESREVENUEGROSSOPERATINGPRE-TAXNETElectronic Materials - SemiconductorPerformance Materials - Aerospace and defensePerformance Materials - Consumer electronicsElectronic Materials - EnergyPerformance Materials - IndustrialPerformance Materials - OtherPerformance Materials - AutomotivePerformance Materials - EnergyElectronic Materials - IndustrialElectronic Materials - Consumer electronicsPrecision Optics - Aerospace and defensePrecision Optics - IndustrialElectronic Materials - Life sciencesPrecision Optics - Life sciencesElectronic Materials - OtherPerformance Materials - SemiconductorElectronic Materials - Aerospace and defensePrecision Optics - Consumer electronicsPrecision Optics - SemiconductorPrecision Optics - AutomotivePerformance Materials - Life sciencesElectronic Materials - AutomotiveNet salesGross marginCost of salesOperating profitOperating costs, including other operating expenses (calculated)Selling, general, and administrative expenseResearch and development expenseRestructuring expenseOther—netIncome before income taxesOther income (expense), net (calculated)Net incomeIncome tax expenseNet salesNet sales$613.91 MGross marginGross margin$104.34 MOperating profitOperating profit$51.71 MIncome before income taxesPretax income$44.50 MNet incomeNet income$38.76 MOperating costs, including other operating expenses (calculated)Operating costs(calculated)$52.63 MElectronic Materials - SemiconductorElectronic Materials - Semiconductor$298.81 MIncome tax expenseIncome tax expense$5.74 MCost of salesCost of sales$509.56 MSelling, general, and administrative expenseSelling, general, andadministrative expense$42.32 MOther income (expense), net (calculated)Other income,net (calculated)−$7.21 MPerformance Materials - Aerospace and defensePerformance Materials -Aerospace and defense$61.52 MResearch and development expenseResearch anddevelopment expense$6.56 MPerformance Materials - Consumer electronicsPerformance Materials- Consumer electronics$46.45 MRestructuring expenseRestructuring expense$324.00 KElectronic Materials - EnergyElectronic Materials - Energy$37.21 MOther—netOther—net$3.42 MPerformance Materials - IndustrialPerformance Materials - Industrial$33.97 MPerformance Materials - OtherPerformance Materials - Other$26.40 MPerformance Materials - AutomotivePerformance Materials - Automotive$18.28 MPerformance Materials - EnergyPerformance Materials - Energy$15.58 MElectronic Materials - IndustrialElectronic Materials - Industrial$14.45 MElectronic Materials - Consumer electronicsElectronic Materials -Consumer electronics$10.46 MPrecision Optics - Aerospace and defensePrecision Optics -Aerospace and defense$9.72 MPrecision Optics - IndustrialPrecision Optics - Industrial$7.87 MElectronic Materials - Life sciencesElectronic Materials - Life sciences$5.84 MPrecision Optics - Life sciencesPrecision Optics - Life sciences$5.53 MElectronic Materials - OtherElectronic Materials - Other$4.73 MPerformance Materials - SemiconductorPerformance Materials- Semiconductor$3.89 MElectronic Materials - Aerospace and defenseElectronic Materials -Aerospace and defense$3.43 MPrecision Optics - Consumer electronicsPrecision Optics -Consumer electronics$3.25 MPrecision Optics - SemiconductorPrecision Optics - Semiconductor$2.43 MPrecision Optics - AutomotivePrecision Optics - Automotive$1.98 MPerformance Materials - Life sciencesPerformance Materials- Life sciences$1.86 MElectronic Materials - AutomotiveElectronic Materials - Automotive$254.00 K
Chart details

MATERION CORPORATION (MTRN) FY2026 Q2 P&L / Income Statement

Income statement for 2026-04-04 through 2026-07-03. View: Segments by Product and Service. Revenue uses this breakdown; costs and expenses retain the consolidated categories.

Net sales
613,906,000 US dollars
Cost of sales
509,564,000 US dollars
Gross margin
104,342,000 US dollars
Operating costs, including other operating expenses (calculated)
52,631,000 US dollars
Operating profit
51,711,000 US dollars
Other income (expense), net (calculated)
negative 7,209,000 US dollars
Income before income taxes
44,502,000 US dollars
Income tax expense
5,744,000 US dollars
Net income
38,758,000 US dollars
Electronic Materials - Aerospace and defense
3,431,000 US dollars
Electronic Materials - Automotive
254,000 US dollars
Electronic Materials - Consumer electronics
10,462,000 US dollars
Electronic Materials - Energy
37,214,000 US dollars
Electronic Materials - Industrial
14,448,000 US dollars
Electronic Materials - Life sciences
5,835,000 US dollars
Electronic Materials - Other
4,730,000 US dollars
Electronic Materials - Semiconductor
298,807,000 US dollars
Performance Materials - Aerospace and defense
61,518,000 US dollars
Performance Materials - Automotive
18,282,000 US dollars
Performance Materials - Consumer electronics
46,452,000 US dollars
Performance Materials - Energy
15,582,000 US dollars
Performance Materials - Industrial
33,966,000 US dollars
Performance Materials - Life sciences
1,856,000 US dollars
Performance Materials - Other
26,402,000 US dollars
Performance Materials - Semiconductor
3,891,000 US dollars
Precision Optics - Aerospace and defense
9,722,000 US dollars
Precision Optics - Automotive
1,979,000 US dollars
Precision Optics - Consumer electronics
3,246,000 US dollars
Precision Optics - Energy
0 US dollars
Precision Optics - Industrial
7,866,000 US dollars
Precision Optics - Life sciences
5,533,000 US dollars
Precision Optics - Other
0 US dollars
Precision Optics - Semiconductor
2,430,000 US dollars
Other - Aerospace and defense
0 US dollars
Other - Automotive
0 US dollars
Other - Consumer electronics
0 US dollars
Other - Energy
0 US dollars
Other - Industrial
0 US dollars
Other - Life sciences
0 US dollars
Other - Other
0 US dollars
Other - Semiconductor
0 US dollars
Selling, general, and administrative expense
42,321,000 US dollars
Research and development expense
6,562,000 US dollars
Restructuring expense
324,000 US dollars
Other—net
3,424,000 US dollars

Chart connections

  • Revenue less cost of revenue equals gross profit; gross profit less operating expenses equals operating income.
  • Operating income plus other income or expense equals income before tax. Income before tax less income tax expense or benefit equals net income.
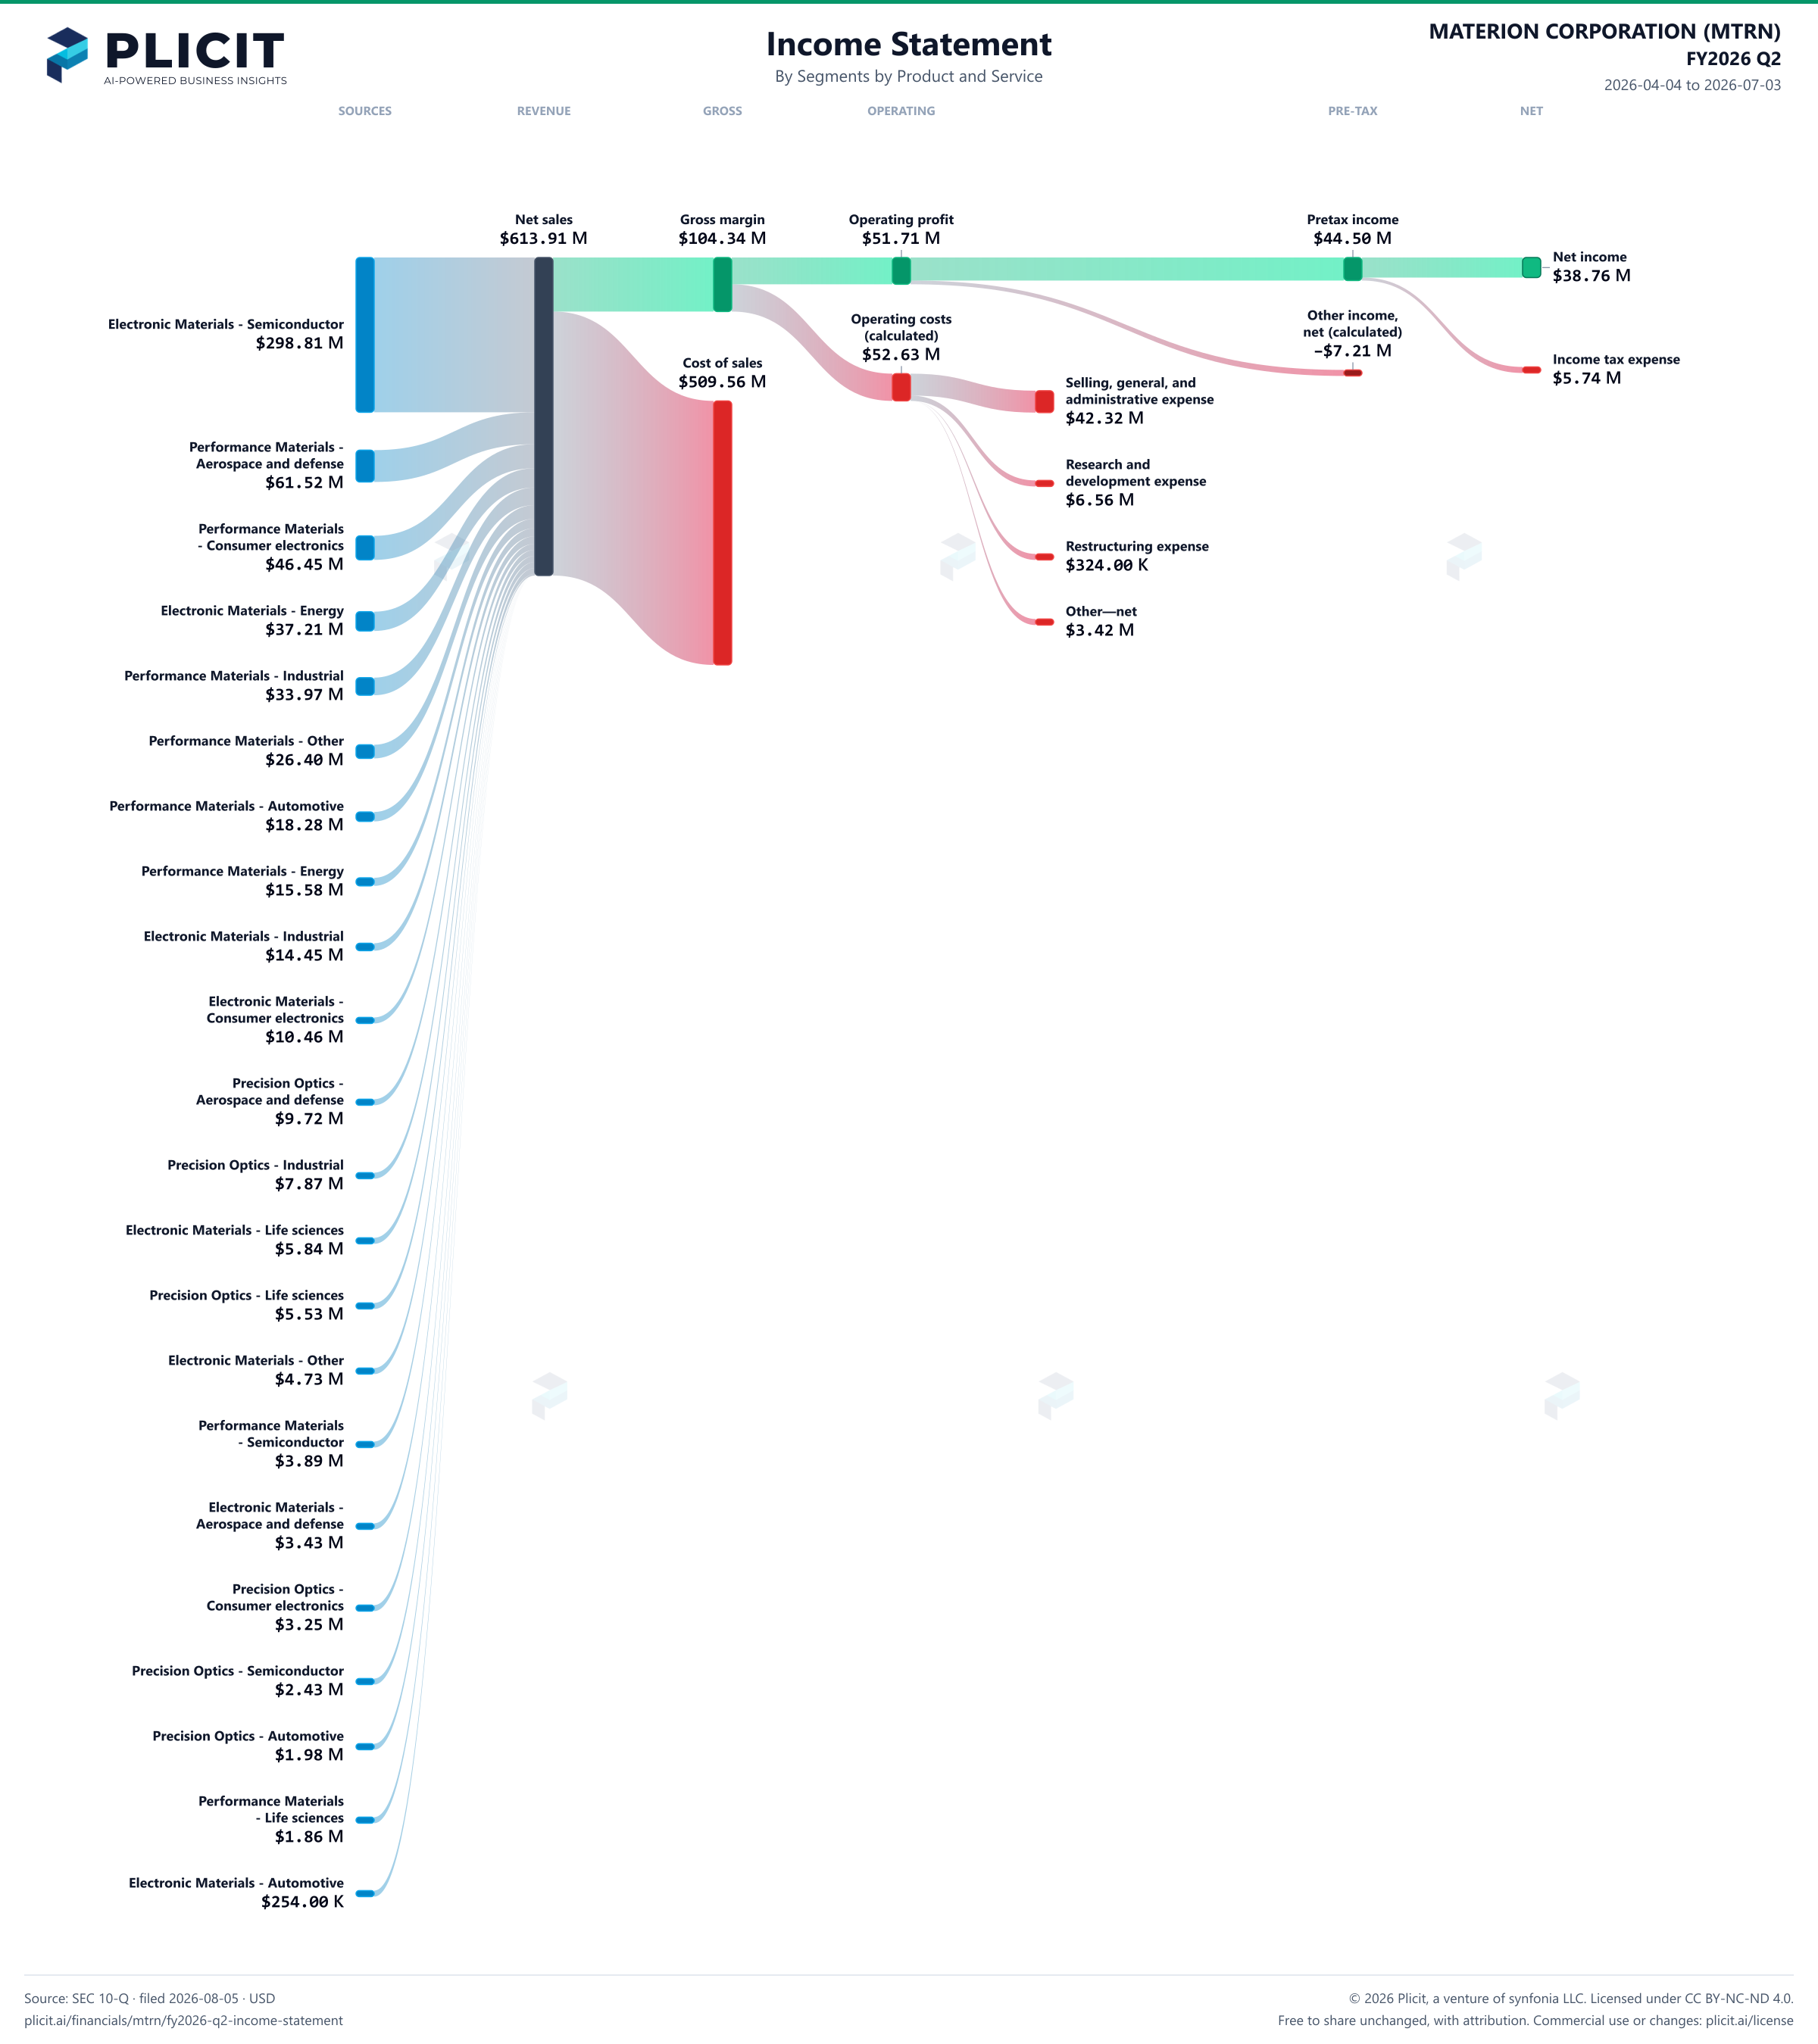
MATERION CORPORATION (MTRN) FY2026 Q2 Revenue by Business Segment by Product and Service Sankey chart
Free to share unchanged, with credit to Plicit.ai · CC BY-NC-ND 4.0Download PNG

Gross margin

17.0%

Gross profit / revenue

Operating margin

8.4%

Operating profit / revenue

Cash conversion

193.0%

Operating cash / net income, same period

Newsletter

Get the teardowns by email

Subscribe if you want the public-company teardowns in your inbox when they're released.

Product waitlist

Health Check and Teardown for your own company

A health check uncovers insights of your private books, not a public ticker. Join this list to get notified as soon as we go-live!