
McEWEN INC. (MUX) FY2026 Q2 Balance Sheet

Balance Sheet

As of 2026-06-30

Swipe to see the full flow
McEWEN INC. (MUX) FY2026 Q2 Balance SheetBalance sheet as of 2026-06-30. The chart shows assets, liabilities and equity at that date.Current liabilities$63.69 MLiabilities$285.47 MCurrent assets$129.74 MNon-current liabilities$221.78 MAssets$992.11 MEquity$706.64 MGross equity(calculated)$1.94 BNon-current assets$862.37 MHOLDINGSASSET CLASSASSETSCLAIM CLASSCLAIM SUB-CLASSCLAIMSCash and cash equivalents (Note 4)Inventories (Note 7)Marketable securities (Note 5)Receivables, prepaids and other current assets (Note 6)Due from McEwen Copper Inc. (Note 14)Equity method investments (Note 9)Mineral property interests and plant and equipment, net (Note 8)Inventories (Note 7)Deferred tax assetsLoan receivable from McEwen Copper Inc. (Note 14)Restricted cash (Note 4)Accounts payable and accrued liabilitiesContract liability (Note 16)Reclamation and remediation liabilities (Note 11)Long-term debt, current portion (Note 10)Lease liabilitiesTax liabilitiesFlow-through share premium (Note 12)Long-term debt, net of issuance costs (Note 10)Deferred tax liabilitiesReclamation and remediation liabilities (Note 11)Other liabilitiesLease liabilitiesCommon shares: 59,744 as at June 30, 2026 (in thousands) (Note 12)Common stock issuable (Note 18)Accumulated other comprehensive incomeCurrent assetsNon-current assetsAssetsCurrent liabilitiesNon-current liabilitiesLiabilitiesEquityGross equity (calculated)Accumulated deficitAccounts payable and accrued liabilitiesAccounts payable and accrued liabilities$41.32 MContract liability (Note 16)Contract liability (Note 16)$8.05 MReclamation and remediation liabilities (Note 11)Reclamation and remediation liabilities (Note 11)$6.81 MCurrent liabilitiesCurrent liabilities$63.69 MLong-term debt, current portion (Note 10)Long-term debt, current portion (Note 10)$6.00 MLease liabilitiesLease liabilities$831.00 KLiabilitiesLiabilities$285.47 MTax liabilitiesTax liabilities$448.00 KFlow-through share premium (Note 12)Flow-through share premium (Note 12)$231.00 KCash and cash equivalents (Note 4)Cash and cash equivalents (Note 4)$78.88 MLong-term debt, net of issuance costs (Note 10)Long-term debt, net of issuance costs (Note 10)$120.57 MCurrent assetsCurrent assets$129.74 MInventories (Note 7)Inventories (Note 7)$27.18 MNon-current liabilitiesNon-current liabilities$221.78 MDeferred tax liabilitiesDeferred tax liabilities$58.74 MMarketable securities (Note 5)Marketable securities (Note 5)$12.83 MReclamation and remediation liabilities (Note 11)Reclamation and remediation liabilities (Note 11)$39.38 MAssetsAssets$992.11 MReceivables, prepaids and other current assets (Note 6)Receivables, prepaids and other current assets (Note 6)$7.85 MOther liabilitiesOther liabilities$2.09 MEquityEquity$706.64 MDue from McEwen Copper Inc. (Note 14)Due from McEwen Copper Inc. (Note 14)$3.00 MLease liabilitiesLease liabilities$995.00 KGross equity (calculated)Gross equity(calculated)$1.94 BNon-current assetsNon-current assets$862.37 MEquity method investments (Note 9)Equity method investments (Note 9)$411.76 MMineral property interests and plant and equipment, net (Note 8)Mineral property interests and plant and equipment, net$376.89 MInventories (Note 7)Inventories (Note 7)$34.04 MCommon shares: 59,744 as at June 30, 2026 (in thousands) (Note 12)Common shares: 59,744 as at June 30$1.91 BDeferred tax assetsDeferred tax assets$22.61 MLoan receivable from McEwen Copper Inc. (Note 14)Loan receivable from McEwen Copper Inc. (Note 14)$12.44 MRestricted cash (Note 4)Restricted cash (Note 4)$4.64 MCommon stock issuable (Note 18)Common stock issuable (Note 18)$32.31 MAccumulated other comprehensive incomeAccumulated other comprehensive income$21.00 KAccumulated deficitAccumulated deficit−$1.23 B
Chart details

McEWEN INC. (MUX) FY2026 Q2 Balance Sheet

Balance sheet as of 2026-06-30. The chart shows assets, liabilities and equity at that date.

Assets
992,106,000 US dollars
Current assets
129,735,000 US dollars
Non-current assets
862,371,000 US dollars
Liabilities
285,470,000 US dollars
Current liabilities
63,692,000 US dollars
Non-current liabilities
221,778,000 US dollars
Equity
706,636,000 US dollars
Cash and cash equivalents (Note 4)
78,883,000 US dollars
Inventories (Note 7)
27,176,000 US dollars
Marketable securities (Note 5)
12,825,000 US dollars
Receivables, prepaids and other current assets (Note 6)
7,848,000 US dollars
Due from McEwen Copper Inc. (Note 14)
3,003,000 US dollars
Equity method investments (Note 9)
411,759,000 US dollars
Mineral property interests and plant and equipment, net (Note 8)
376,887,000 US dollars
Inventories (Note 7)
34,036,000 US dollars
Deferred tax assets
22,612,000 US dollars
Loan receivable from McEwen Copper Inc. (Note 14)
12,440,000 US dollars
Restricted cash (Note 4)
4,637,000 US dollars
Accounts payable and accrued liabilities
41,324,000 US dollars
Contract liability (Note 16)
8,050,000 US dollars
Reclamation and remediation liabilities (Note 11)
6,808,000 US dollars
Long-term debt, current portion (Note 10)
6,000,000 US dollars
Lease liabilities
831,000 US dollars
Tax liabilities
448,000 US dollars
Flow-through share premium (Note 12)
231,000 US dollars
Long-term debt, net of issuance costs (Note 10)
120,572,000 US dollars
Deferred tax liabilities
58,738,000 US dollars
Reclamation and remediation liabilities (Note 11)
39,379,000 US dollars
Other liabilities
2,094,000 US dollars
Lease liabilities
995,000 US dollars
Common shares: 59,744 as at June 30, 2026 (in thousands) (Note 12)
1,906,616,000 US dollars
Common stock issuable (Note 18)
32,307,000 US dollars
Accumulated other comprehensive income
21,000 US dollars
Accumulated deficit
negative 1,232,308,000 US dollars
Gross equity (calculated)
1,938,944,000 US dollars. Net equity plus the magnitudes of its negative contributions equals gross positive equity. The negative contributions enter this reconciliation as add-backs; their filed signs stay negative.

Chart connections

  • Assets equal liabilities plus consolidated equity. Consolidated equity includes noncontrolling interests when reported.
  • Treasury shares and other negative equity contributions reduce equity.
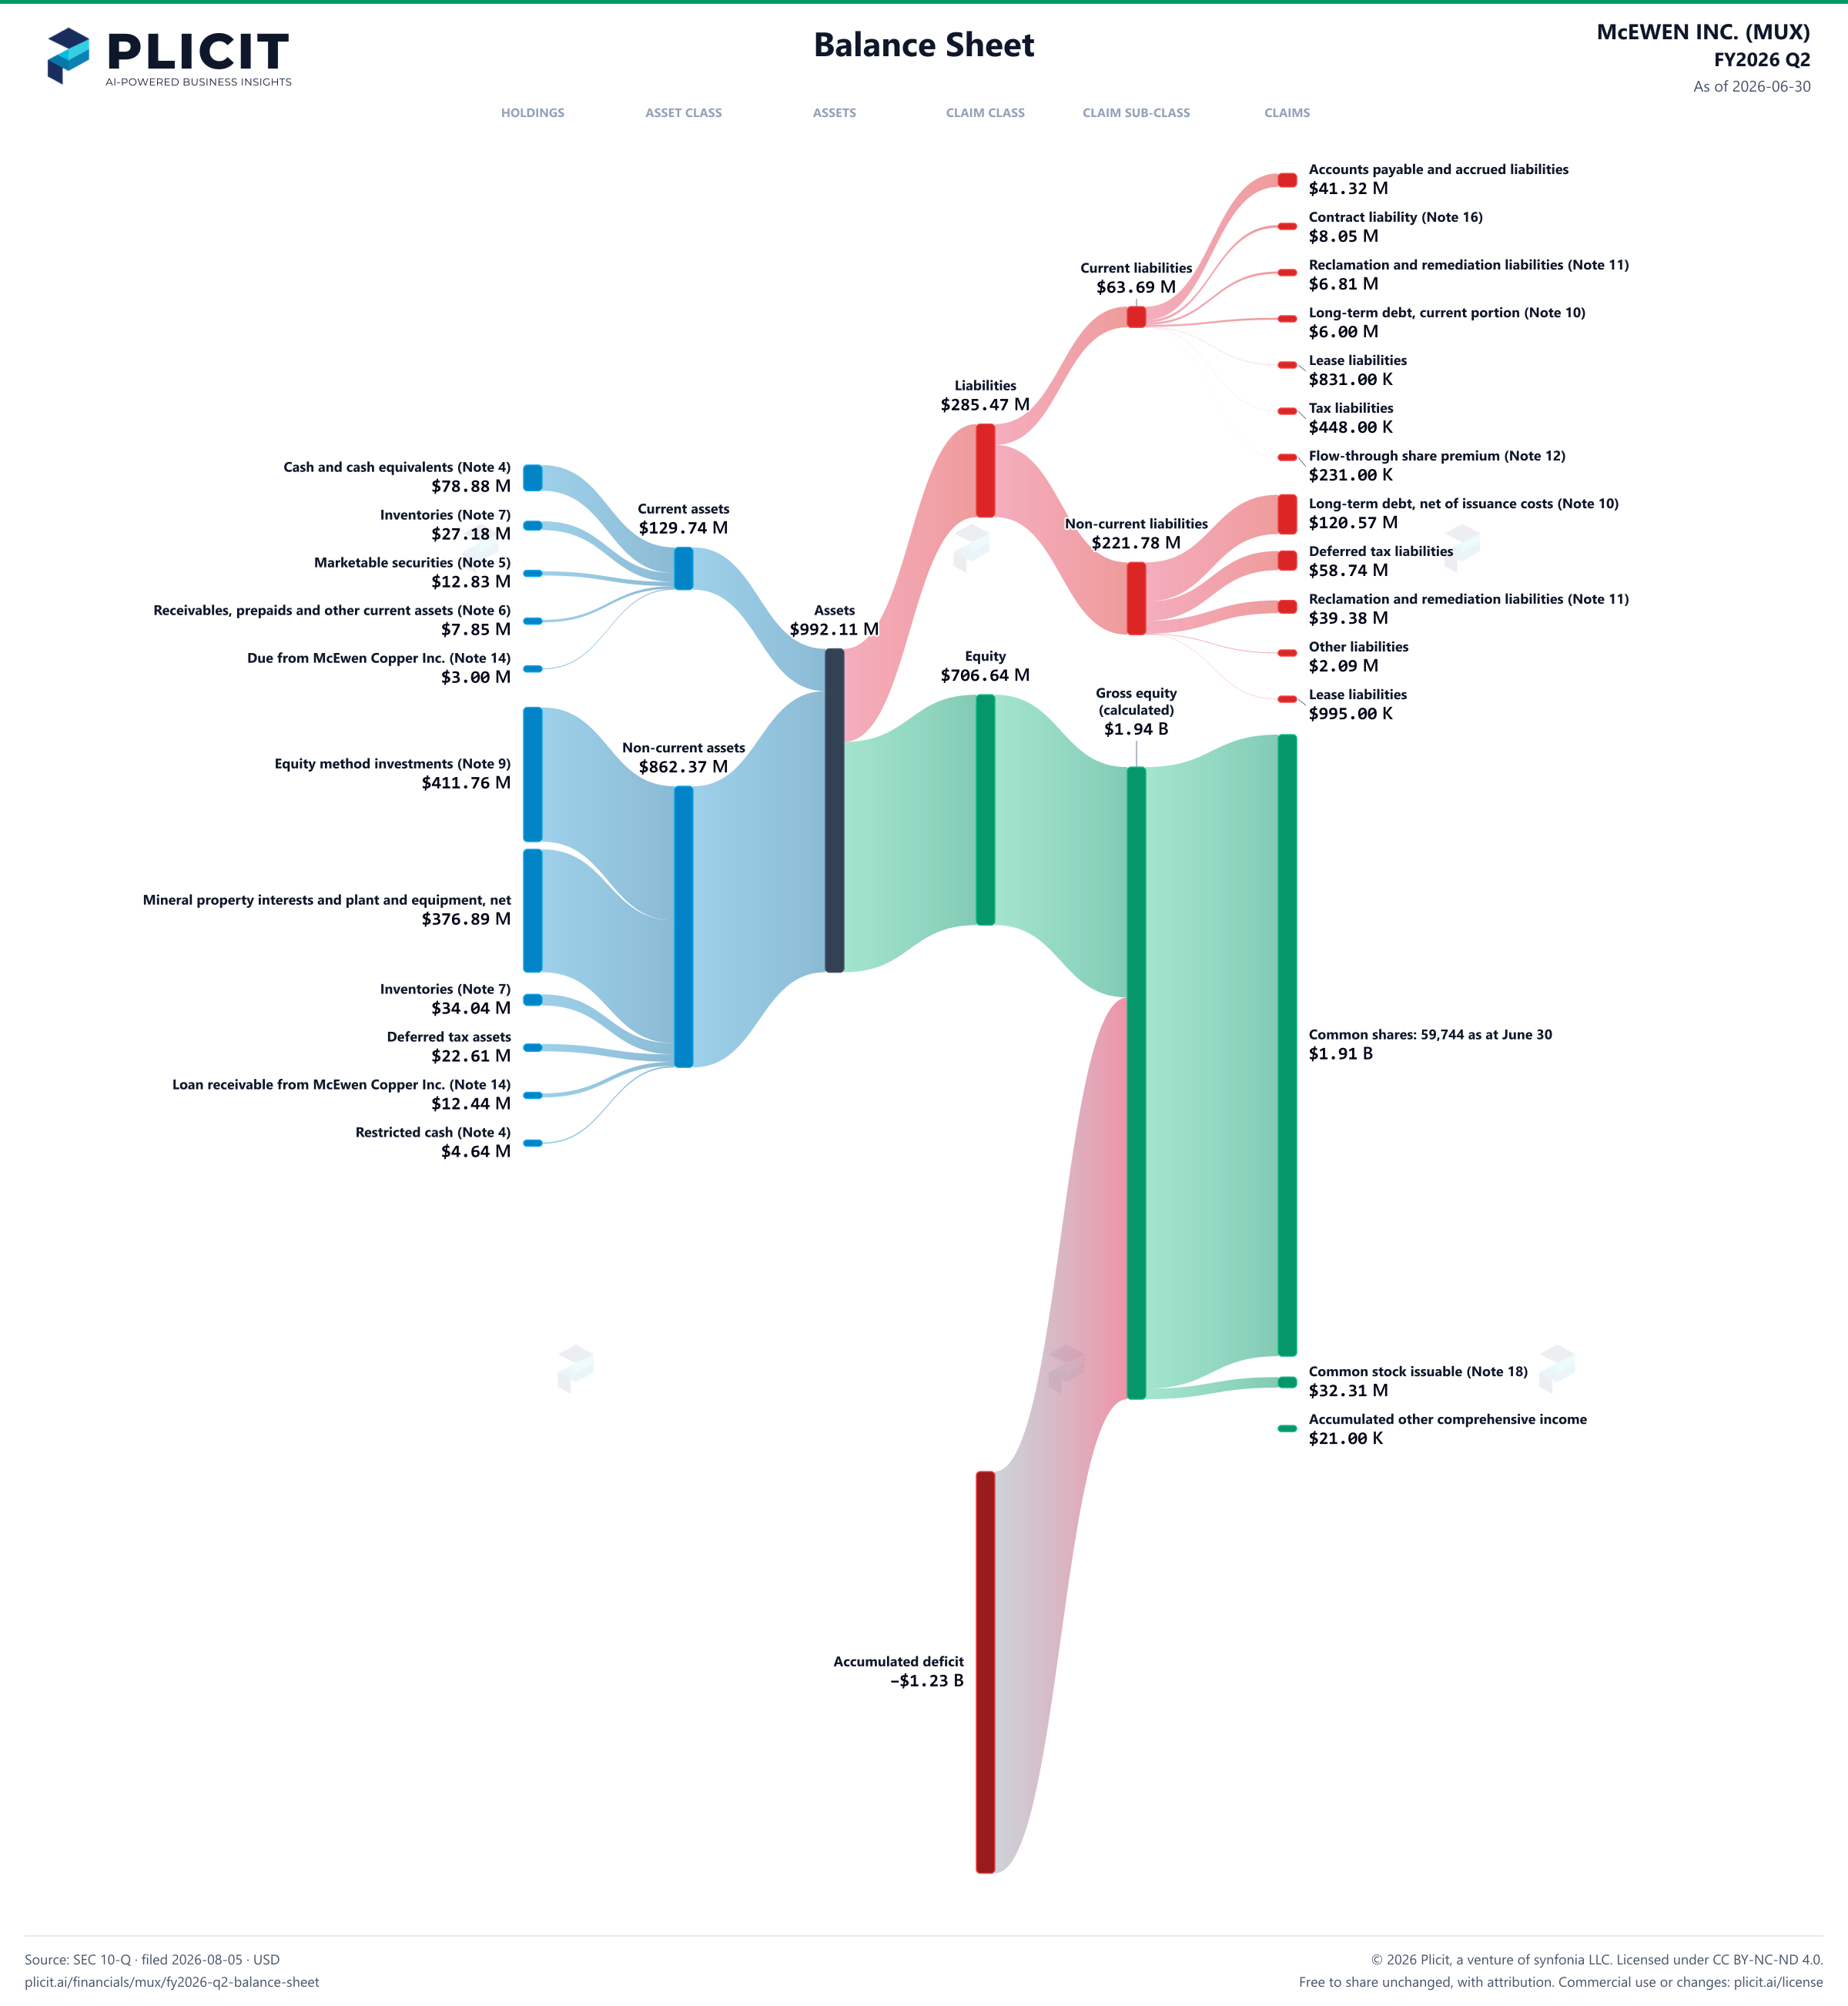
McEWEN INC. (MUX) FY2026 Q2 Balance Sheet Sankey chart
Free to share unchanged, with credit to Plicit.ai · CC BY-NC-ND 4.0Download PNG

Newsletter

Get the teardowns by email

Subscribe if you want the public-company teardowns in your inbox when they're released.

Product waitlist

Health Check and Teardown for your own company

A health check uncovers insights of your private books, not a public ticker. Join this list to get notified as soon as we go-live!