
nCino, Inc. (NCNO) FY2027 Q1 Balance Sheet

Published Source: Form 10-Q on SEC EDGAR filed (opens in a new tab)

As of 2026-04-30

Balance Sheet

Swipe to see the full flow
nCino, Inc. (NCNO) FY2027 Q1 Balance SheetBalance sheet as of 2026-04-30. The chart shows assets, liabilities and equity at that date.Current liabilities$299.86 MCurrent assets$267.43 MLiabilities$623.38 MAssets$1.61 BNon-current liabilities$323.52 MRedeemablenon-controllinginterest (Note 2)$14.09 MNon-current assets$1.34 BEquity$970.36 MHOLDINGSASSET CLASSASSETSCLAIM CLASSCLAIM SUB-CLASSCLAIMSAccounts receivable, less allowances of $2,825 and $2,739 at January 31, 2026 and April 30, 2026, respectivelyCash and cash equivalents (VIE: $3,421 and $8,498 at January 31, 2026 and April 30, 2026, respectively)Prepaid expenses and other current assetsCosts capitalized to obtain revenue contracts, current portion, netGoodwillIntangible assets, netProperty and equipment, netCosts capitalized to obtain revenue contracts, noncurrent, netLong-term prepaid expenses and other assetsOperating lease right-of-use assets, netInvestmentsDeferred revenue, current portionAccrued expenses and other current liabilitiesAccounts payableDebt, current portion, netOperating lease liabilities, current portionFinancing obligations, current portionDebt, noncurrent, netFinancing obligations, noncurrentOperating lease liabilities, noncurrentDeferred income taxes, noncurrentOther long-term liabilitiesDeferred revenue, noncurrentAdditional paid-in capitalAccumulated other comprehensive incomeCommon stock, $0.0005 par value; 500,000,000 shares authorized at January 31, 2026 and April 30, 2026; 118,868,921 and 119,882,698 shares issued; 113,904,867 and 108,794,598 outstanding at January 31, 2026 and April 30, 2026, respectivelyAccumulated deficitTreasury stock, at cost; 4,964,054 and 11,088,100 shares at January 31, 2026 and April 30, 2026, respectivelyCurrent assetsNon-current assetsAssetsCurrent liabilitiesNon-current liabilitiesLiabilitiesRedeemable non-controlling interest (Note 2)EquityEquityDeferred revenue, current portionDeferred revenue, current portion$225.05 MAccrued expenses and other current liabilitiesAccrued expenses and other current liabilities$44.49 MCurrent liabilitiesCurrent liabilities$299.86 MAccounts receivable, less allowances of $2,825 and $2,739 at January 31, 2026 and April 30, 2026, respectivelyAccounts receivable, net$124.74 MAccounts payableAccounts payable$15.71 MCurrent assetsCurrent assets$267.43 MCash and cash equivalents (VIE: $3,421 and $8,498 at January 31, 2026 and April 30, 2026, respectively)Cash and cash equivalents$102.81 MDebt, current portion, netDebt, current portion, net$9.80 MPrepaid expenses and other current assetsPrepaid expenses and other current assets$22.88 MOperating lease liabilities, current portionOperating lease liabilities, current portion$4.20 MLiabilitiesLiabilities$623.38 MCosts capitalized to obtain revenue contracts, current portion, netCosts capitalized to obtain revenuecontracts, current portion, net$16.99 MFinancing obligations, current portionFinancing obligations, current portion$607.00 KDebt, noncurrent, netDebt, noncurrent, net$253.01 MFinancing obligations, noncurrentFinancing obligations, noncurrent$50.29 MAssetsAssets$1.61 BNon-current liabilitiesNon-current liabilities$323.52 MOperating lease liabilities, noncurrentOperating lease liabilities, noncurrent$8.80 MRedeemable non-controlling interest (Note 2)Redeemablenon-controllinginterest (Note 2)$14.09 MDeferred income taxes, noncurrentDeferred income taxes, noncurrent$7.53 MGoodwillGoodwill$1.08 BOther long-term liabilitiesOther long-term liabilities$3.80 MNon-current assetsNon-current assets$1.34 BDeferred revenue, noncurrentDeferred revenue, noncurrent$102.00 KEquityEquity$970.36 MIntangible assets, netIntangible assets, net$126.22 MProperty and equipment, netProperty and equipment, net$74.84 MAdditional paid-in capitalAdditional paid-in capital$1.55 BCosts capitalized to obtain revenue contracts, noncurrent, netCosts capitalized to obtainrevenue contracts, noncurrent, net$29.64 MLong-term prepaid expenses and other assetsLong-term prepaid expenses and other assets$14.52 MAccumulated other comprehensive incomeAccumulated other comprehensive income$4.02 MOperating lease right-of-use assets, netOperating lease right-of-use assets, net$11.83 MCommon stock, $0.0005 par value; 500,000,000 shares authorized at January 31, 2026 and April 30, 2026; 118,868,921 and 119,882,698 shares issued; 113,904,867 and 108,794,598 outstanding at January 31, 2026 and April 30, 2026, respectivelyCommon stock$60.00 KInvestmentsInvestments$7.26 MAccumulated deficitAccumulated deficit−$361.43 MTreasury stock, at cost; 4,964,054 and 11,088,100 shares at January 31, 2026 and April 30, 2026, respectivelyBought back (treasury stock)−$219.26 M
Chart details

nCino, Inc. (NCNO) FY2027 Q1 Balance Sheet

Balance sheet as of 2026-04-30. The chart shows assets, liabilities and equity at that date.

Assets
1,607,830,000 US dollars
Current assets
267,427,000 US dollars
Non-current assets
1,340,403,000 US dollars
Liabilities
623,384,000 US dollars
Current liabilities
299,861,000 US dollars
Non-current liabilities
323,523,000 US dollars
Equity
970,359,000 US dollars
Redeemable non-controlling interest (Note 2)
14,087,000 US dollars
Accounts receivable, less allowances of $2,825 and $2,739 at January 31, 2026 and April 30, 2026, respectively
124,742,000 US dollars
Cash and cash equivalents (VIE: $3,421 and $8,498 at January 31, 2026 and April 30, 2026, respectively)
102,813,000 US dollars
Prepaid expenses and other current assets
22,883,000 US dollars
Costs capitalized to obtain revenue contracts, current portion, net
16,989,000 US dollars
Goodwill
1,076,098,000 US dollars
Intangible assets, net
126,215,000 US dollars
Property and equipment, net
74,837,000 US dollars
Costs capitalized to obtain revenue contracts, noncurrent, net
29,639,000 US dollars
Long-term prepaid expenses and other assets
14,519,000 US dollars
Operating lease right-of-use assets, net
11,833,000 US dollars
Investments
7,262,000 US dollars
Deferred revenue, current portion
225,049,000 US dollars
Accrued expenses and other current liabilities
44,488,000 US dollars
Accounts payable
15,710,000 US dollars
Debt, current portion, net
9,803,000 US dollars
Operating lease liabilities, current portion
4,204,000 US dollars
Financing obligations, current portion
607,000 US dollars
Debt, noncurrent, net
253,007,000 US dollars
Financing obligations, noncurrent
50,290,000 US dollars
Operating lease liabilities, noncurrent
8,801,000 US dollars
Deferred income taxes, noncurrent
7,528,000 US dollars
Other long-term liabilities
3,795,000 US dollars
Deferred revenue, noncurrent
102,000 US dollars
Additional paid-in capital
1,546,967,000 US dollars
Accumulated other comprehensive income
4,016,000 US dollars
Common stock, $0.0005 par value; 500,000,000 shares authorized at January 31, 2026 and April 30, 2026; 118,868,921 and 119,882,698 shares issued; 113,904,867 and 108,794,598 outstanding at January 31, 2026 and April 30, 2026, respectively
60,000 US dollars
Preferred stock, $0.001 par value; 10,000,000 shares authorized, and none issued and outstanding at January 31, 2026 and April 30, 2026
0 US dollars
Accumulated deficit
negative 361,429,000 US dollars
Treasury stock, at cost; 4,964,054 and 11,088,100 shares at January 31, 2026 and April 30, 2026, respectively
negative 219,255,000 US dollars

Chart connections

  • Assets equal liabilities plus temporary equity plus consolidated equity. Consolidated equity includes noncontrolling interests when reported.
  • Treasury shares and other negative equity contributions reduce equity.
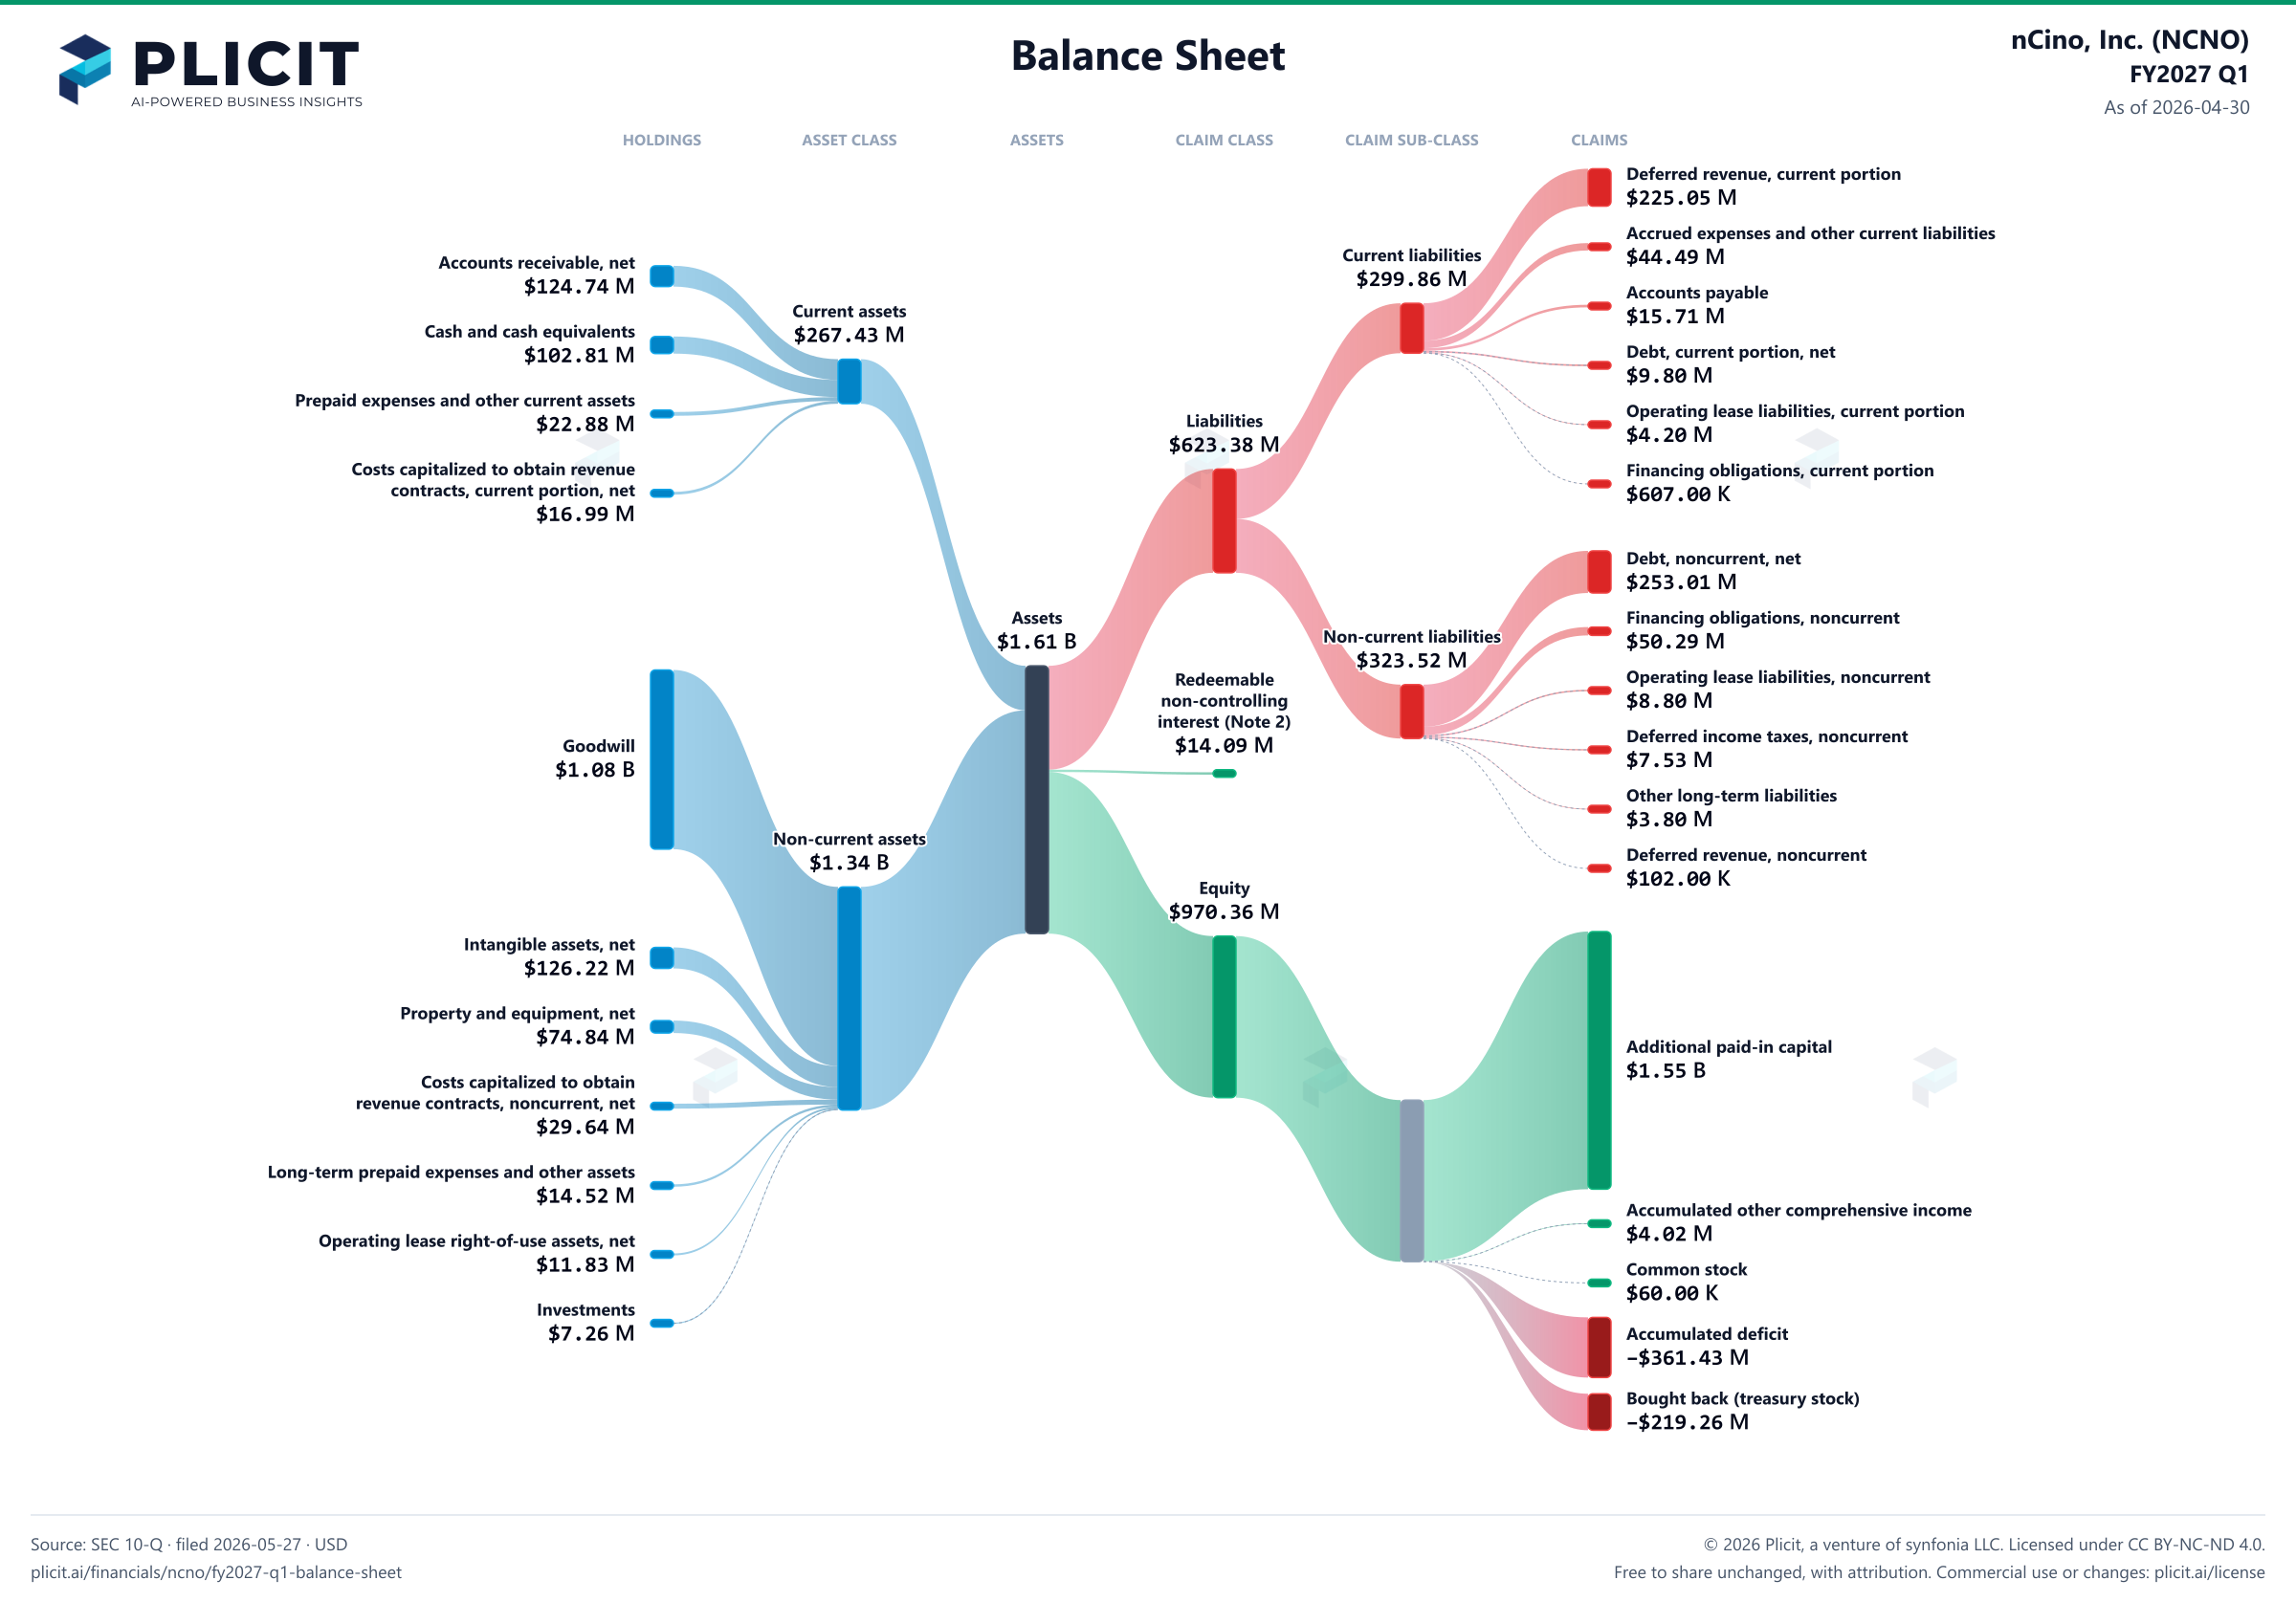
nCino, Inc. (NCNO) FY2027 Q1 Balance Sheet Sankey chart
Free to share unchanged, with credit to Plicit.ai · CC BY-NC-ND 4.0Download PNG

Product waitlist

Health Check and Teardown for your own company

A health check uncovers insights of your private books, not a public ticker. Join this list to get notified as soon as we go-live!