
Nasdaq, Inc. (NDAQ) FY2026 Q2 Balance Sheet

Balance Sheet

As of 2026-06-30

Swipe to see the full flow
Nasdaq, Inc. (NDAQ) FY2026 Q2 Balance SheetBalance sheet as of 2026-06-30. The chart shows assets, liabilities and equity at that date.Current liabilities$4.51 BCurrent assets$4.53 BLiabilities$15.35 BAssets$27.34 BNon-current liabilities$10.84 BNon-current assets$22.81 BEquity$11.99 BGross equity(calculated)$14.65 BHOLDINGSASSET CLASSASSETSCLAIM CLASSCLAIM SUB-CLASSCLAIMSDefault funds and margin deposits (including restricted cash and cash equivalents of $254 and $3,120, respectively)Receivables, netCash and cash equivalentsOther current assetsFinancial investmentsRestricted cash and cash equivalentsGoodwillIntangible assets, netOther non-current assetsProperty and equipment, netOperating lease assetsDefault funds and margin depositsDeferred revenueSection 31 fees payable to SECShort-term debtAccounts payable and accrued expensesAccrued personnel costsOther current liabilitiesLong-term debtDeferred tax liabilities, netOperating lease liabilitiesOther non-current liabilitiesRetained earningsAdditional paid-in capitalCommon stock, $0.01 par value, 900,000,000 shares authorized, shares issued: 587,518,685 at June 30, 2026 and 594,620,320 at December 31, 2025; shares outstanding: 561,990,385 at June 30, 2026 and 569,894,024 at December 31, 2025Noncontrolling interestsCurrent assetsNon-current assetsAssetsCurrent liabilitiesNon-current liabilitiesLiabilitiesEquityGross equity (calculated)Accumulated other comprehensive lossCommon stock in treasury, at cost: 25,528,300 shares at June 30, 2026 and 24,726,296 shares at December 31, 2025Default funds and margin depositsDefault funds and margin deposits$2.32 BDeferred revenueDeferred revenue$931.00 MCurrent liabilitiesCurrent liabilities$4.51 BDefault funds and margin deposits (including restricted cash and cash equivalents of $254 and $3,120, respectively)Default funds and margin deposits$2.32 BSection 31 fees payable to SECSection 31 fees payable to SEC$313.00 MShort-term debtShort-term debt$269.00 MReceivables, netReceivables, net$1.18 BCurrent assetsCurrent assets$4.53 BLiabilitiesLiabilities$15.35 BAccounts payable and accrued expensesAccounts payable and accrued expenses$252.00 MCash and cash equivalentsCash and cash equivalents$520.00 MAssetsAssets$27.34 BAccrued personnel costsAccrued personnel costs$243.00 MOther current assetsOther current assets$284.00 MOther current liabilitiesOther current liabilities$174.00 MFinancial investmentsFinancial investments$198.00 MRestricted cash and cash equivalentsRestricted cash and cash equivalents$26.00 MNon-current liabilitiesNon-current liabilities$10.84 BLong-term debtLong-term debt$8.49 BNon-current assetsNon-current assets$22.81 BDeferred tax liabilities, netDeferred tax liabilities, net$1.62 BGoodwillGoodwill$14.25 BEquityEquity$11.99 BOperating lease liabilitiesOperating lease liabilities$482.00 MOther non-current liabilitiesOther non-current liabilities$253.00 MGross equity (calculated)Gross equity(calculated)$14.65 BIntangible assets, netIntangible assets, net$6.22 BRetained earningsRetained earnings$10.29 BOther non-current assetsOther non-current assets$1.09 BProperty and equipment, netProperty and equipment, net$767.00 MAdditional paid-in capitalAdditional paid-in capital$4.35 BOperating lease assetsOperating lease assets$481.00 MCommon stock, $0.01 par value, 900,000,000 shares authorized, shares issued: 587,518,685 at June 30, 2026 and 594,620,320 at December 31, 2025; shares outstanding: 561,990,385 at June 30, 2026 and 569,894,024 at December 31, 2025Common stock$6.00 MNoncontrolling interestsNoncontrolling interests$5.00 MAccumulated other comprehensive lossAccumulated other comprehensive loss−$1.87 BCommon stock in treasury, at cost: 25,528,300 shares at June 30, 2026 and 24,726,296 shares at December 31, 2025Common stock in treasury−$784.00 M
Chart details

Nasdaq, Inc. (NDAQ) FY2026 Q2 Balance Sheet

Balance sheet as of 2026-06-30. The chart shows assets, liabilities and equity at that date.

Assets
27,341,000,000 US dollars
Current assets
4,533,000,000 US dollars
Non-current assets
22,808,000,000 US dollars
Liabilities
15,348,000,000 US dollars
Current liabilities
4,505,000,000 US dollars
Non-current liabilities
10,843,000,000 US dollars
Equity
11,993,000,000 US dollars
Noncontrolling interest
5,000,000 US dollars. Included in consolidated equity; this amount is not added again.
Default funds and margin deposits (including restricted cash and cash equivalents of $254 and $3,120, respectively)
2,323,000,000 US dollars
Receivables, net
1,182,000,000 US dollars
Cash and cash equivalents
520,000,000 US dollars
Other current assets
284,000,000 US dollars
Financial investments
198,000,000 US dollars
Restricted cash and cash equivalents
26,000,000 US dollars
Goodwill
14,245,000,000 US dollars
Intangible assets, net
6,223,000,000 US dollars
Other non-current assets
1,092,000,000 US dollars
Property and equipment, net
767,000,000 US dollars
Operating lease assets
481,000,000 US dollars
Default funds and margin deposits
2,323,000,000 US dollars
Deferred revenue
931,000,000 US dollars
Section 31 fees payable to SEC
313,000,000 US dollars
Short-term debt
269,000,000 US dollars
Accounts payable and accrued expenses
252,000,000 US dollars
Accrued personnel costs
243,000,000 US dollars
Other current liabilities
174,000,000 US dollars
Long-term debt
8,492,000,000 US dollars
Deferred tax liabilities, net
1,616,000,000 US dollars
Operating lease liabilities
482,000,000 US dollars
Other non-current liabilities
253,000,000 US dollars
Retained earnings
10,287,000,000 US dollars
Additional paid-in capital
4,353,000,000 US dollars
Common stock, $0.01 par value, 900,000,000 shares authorized, shares issued: 587,518,685 at June 30, 2026 and 594,620,320 at December 31, 2025; shares outstanding: 561,990,385 at June 30, 2026 and 569,894,024 at December 31, 2025
6,000,000 US dollars
Noncontrolling interests
5,000,000 US dollars
Accumulated other comprehensive loss
negative 1,874,000,000 US dollars
Common stock in treasury, at cost: 25,528,300 shares at June 30, 2026 and 24,726,296 shares at December 31, 2025
negative 784,000,000 US dollars
Gross equity (calculated)
14,651,000,000 US dollars. Net equity plus the magnitudes of its negative contributions equals gross positive equity. The negative contributions enter this reconciliation as add-backs; their filed signs stay negative.

Chart connections

  • Assets equal liabilities plus consolidated equity. Consolidated equity includes noncontrolling interests when reported.
  • Treasury shares and other negative equity contributions reduce equity.
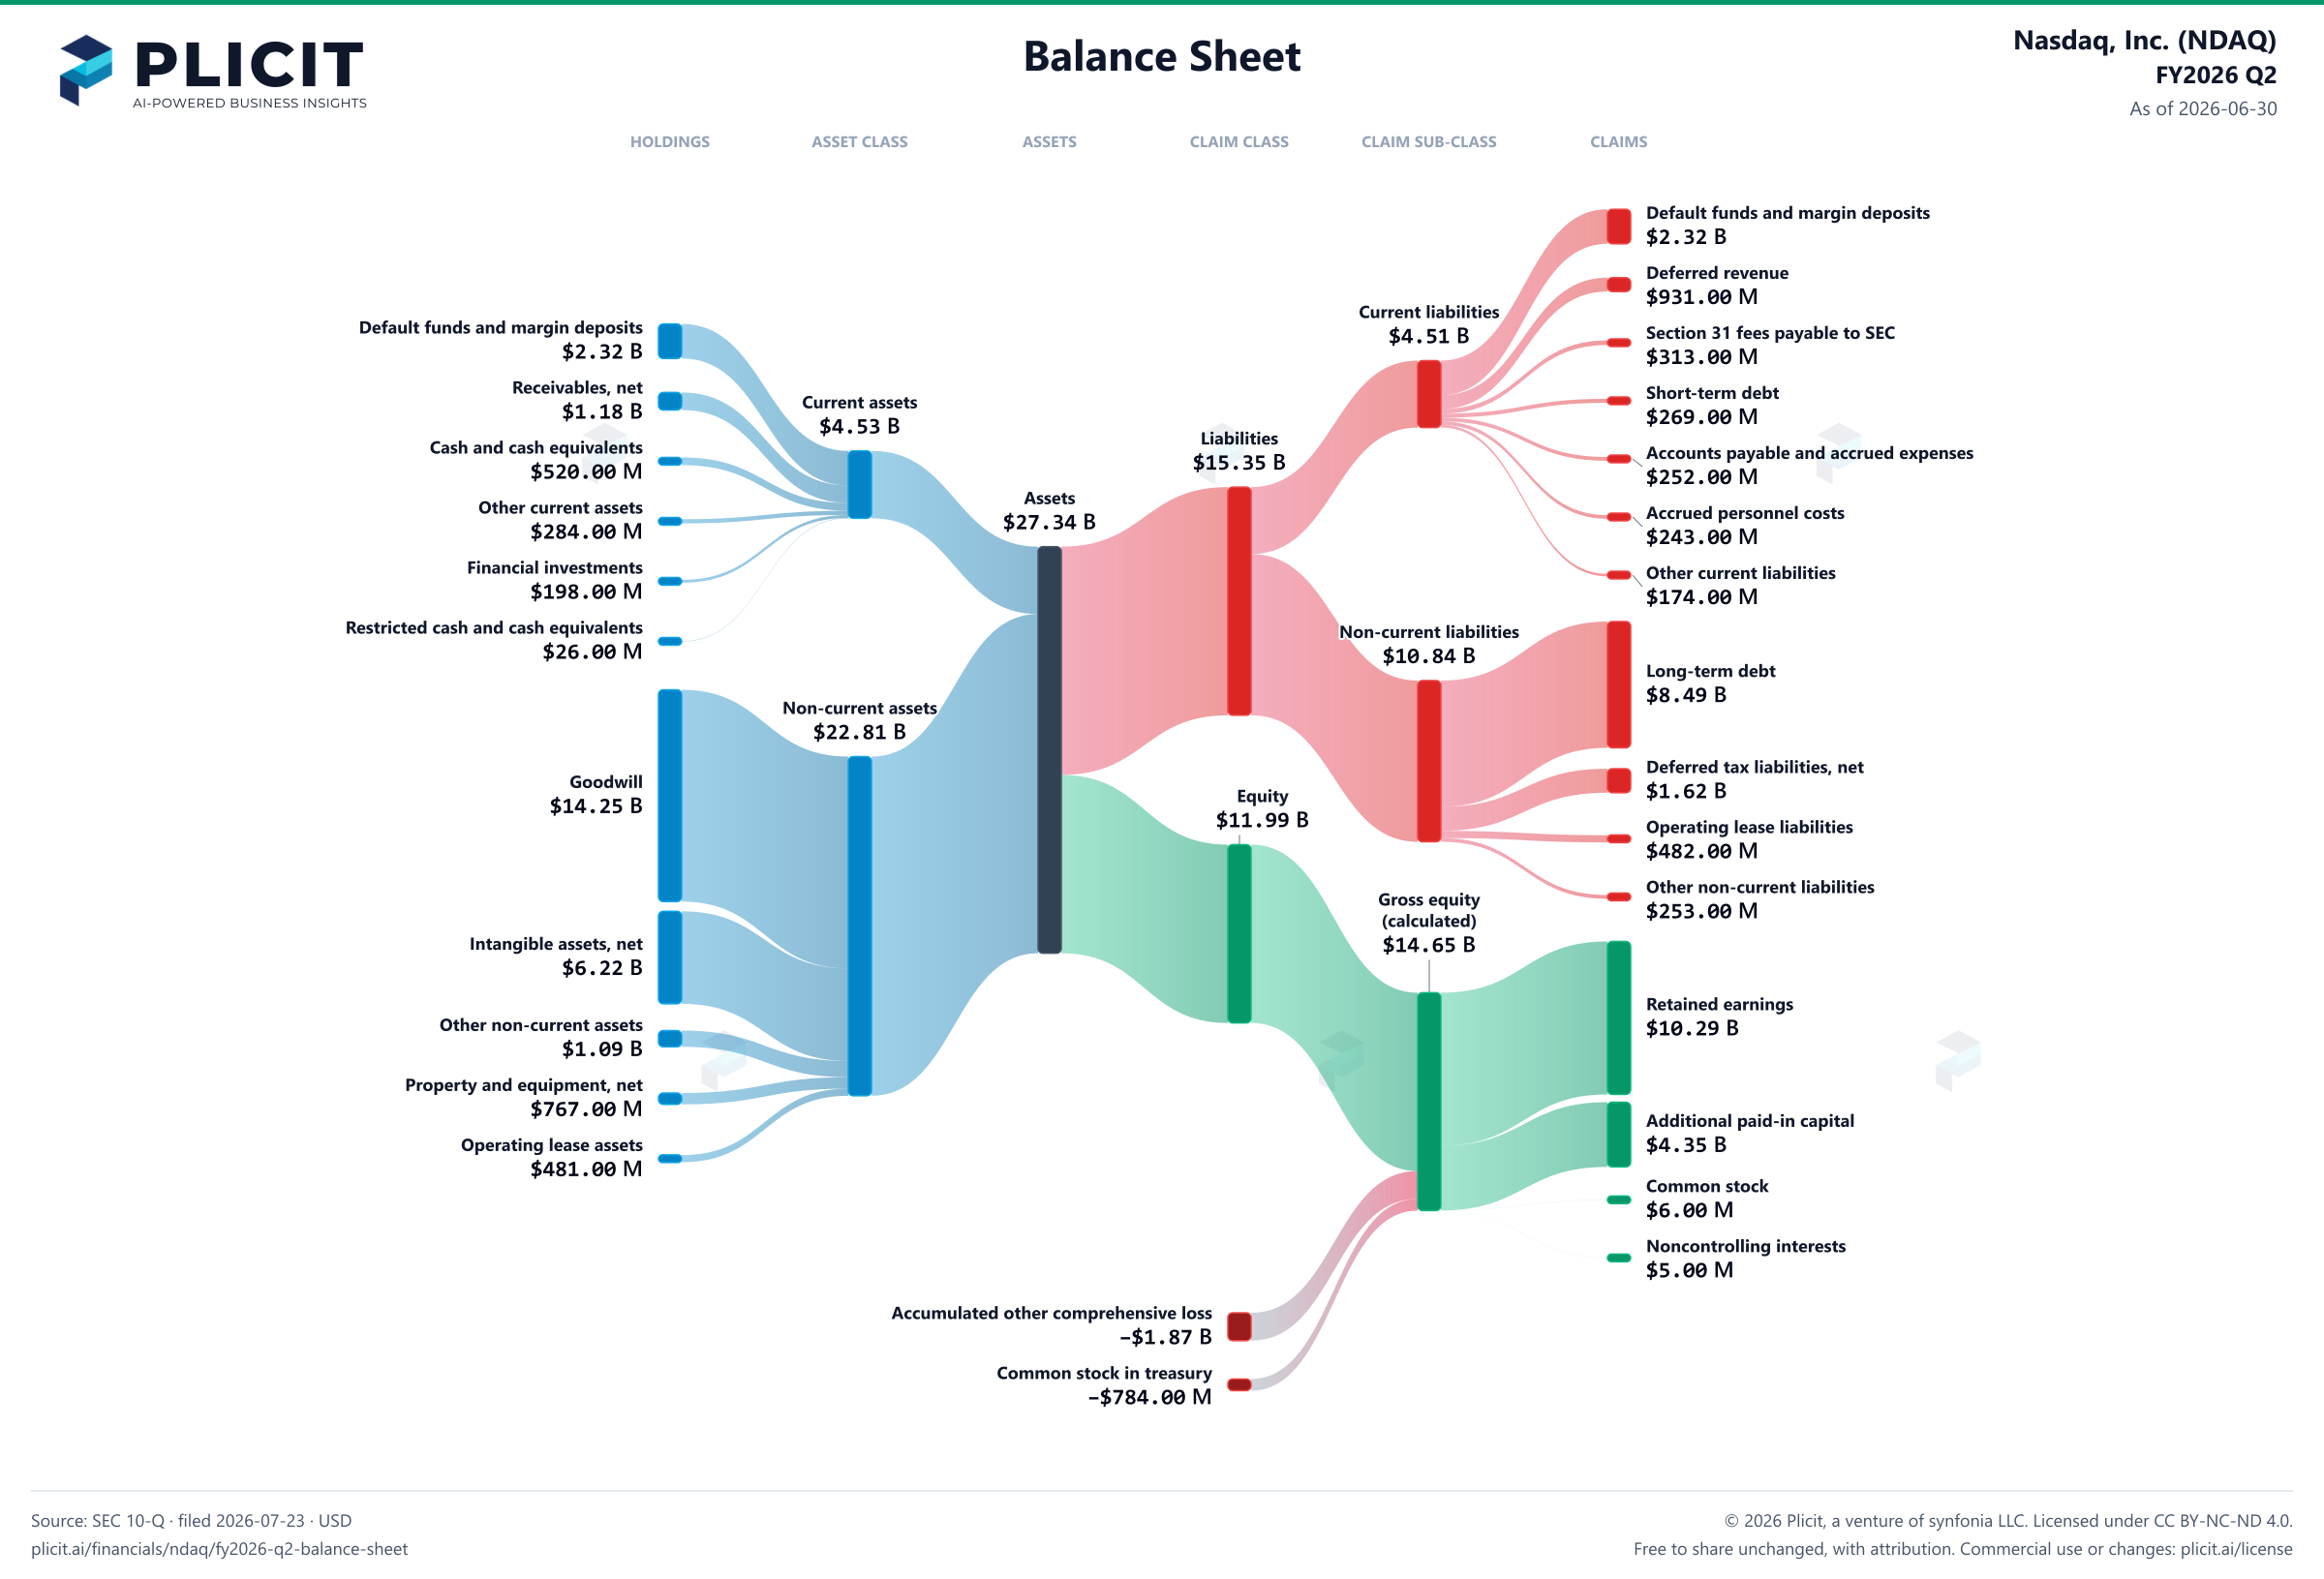
Nasdaq, Inc. (NDAQ) FY2026 Q2 Balance Sheet Sankey chart
Free to share unchanged, with credit to Plicit.ai · CC BY-NC-ND 4.0Download PNG

Newsletter

Get the teardowns by email

Subscribe if you want the public-company teardowns in your inbox when they're released.

Product waitlist

Health Check and Teardown for your own company

A health check uncovers insights of your private books, not a public ticker. Join this list to get notified as soon as we go-live!