
NORTHERN OIL AND GAS, INC. (NOG) FY2026 Q2 Balance Sheet
As of 2026-06-30
Balance Sheet
As of 2026-06-30
Swipe to see the full flow
Chart details
NORTHERN OIL AND GAS, INC. (NOG) FY2026 Q2 Balance Sheet
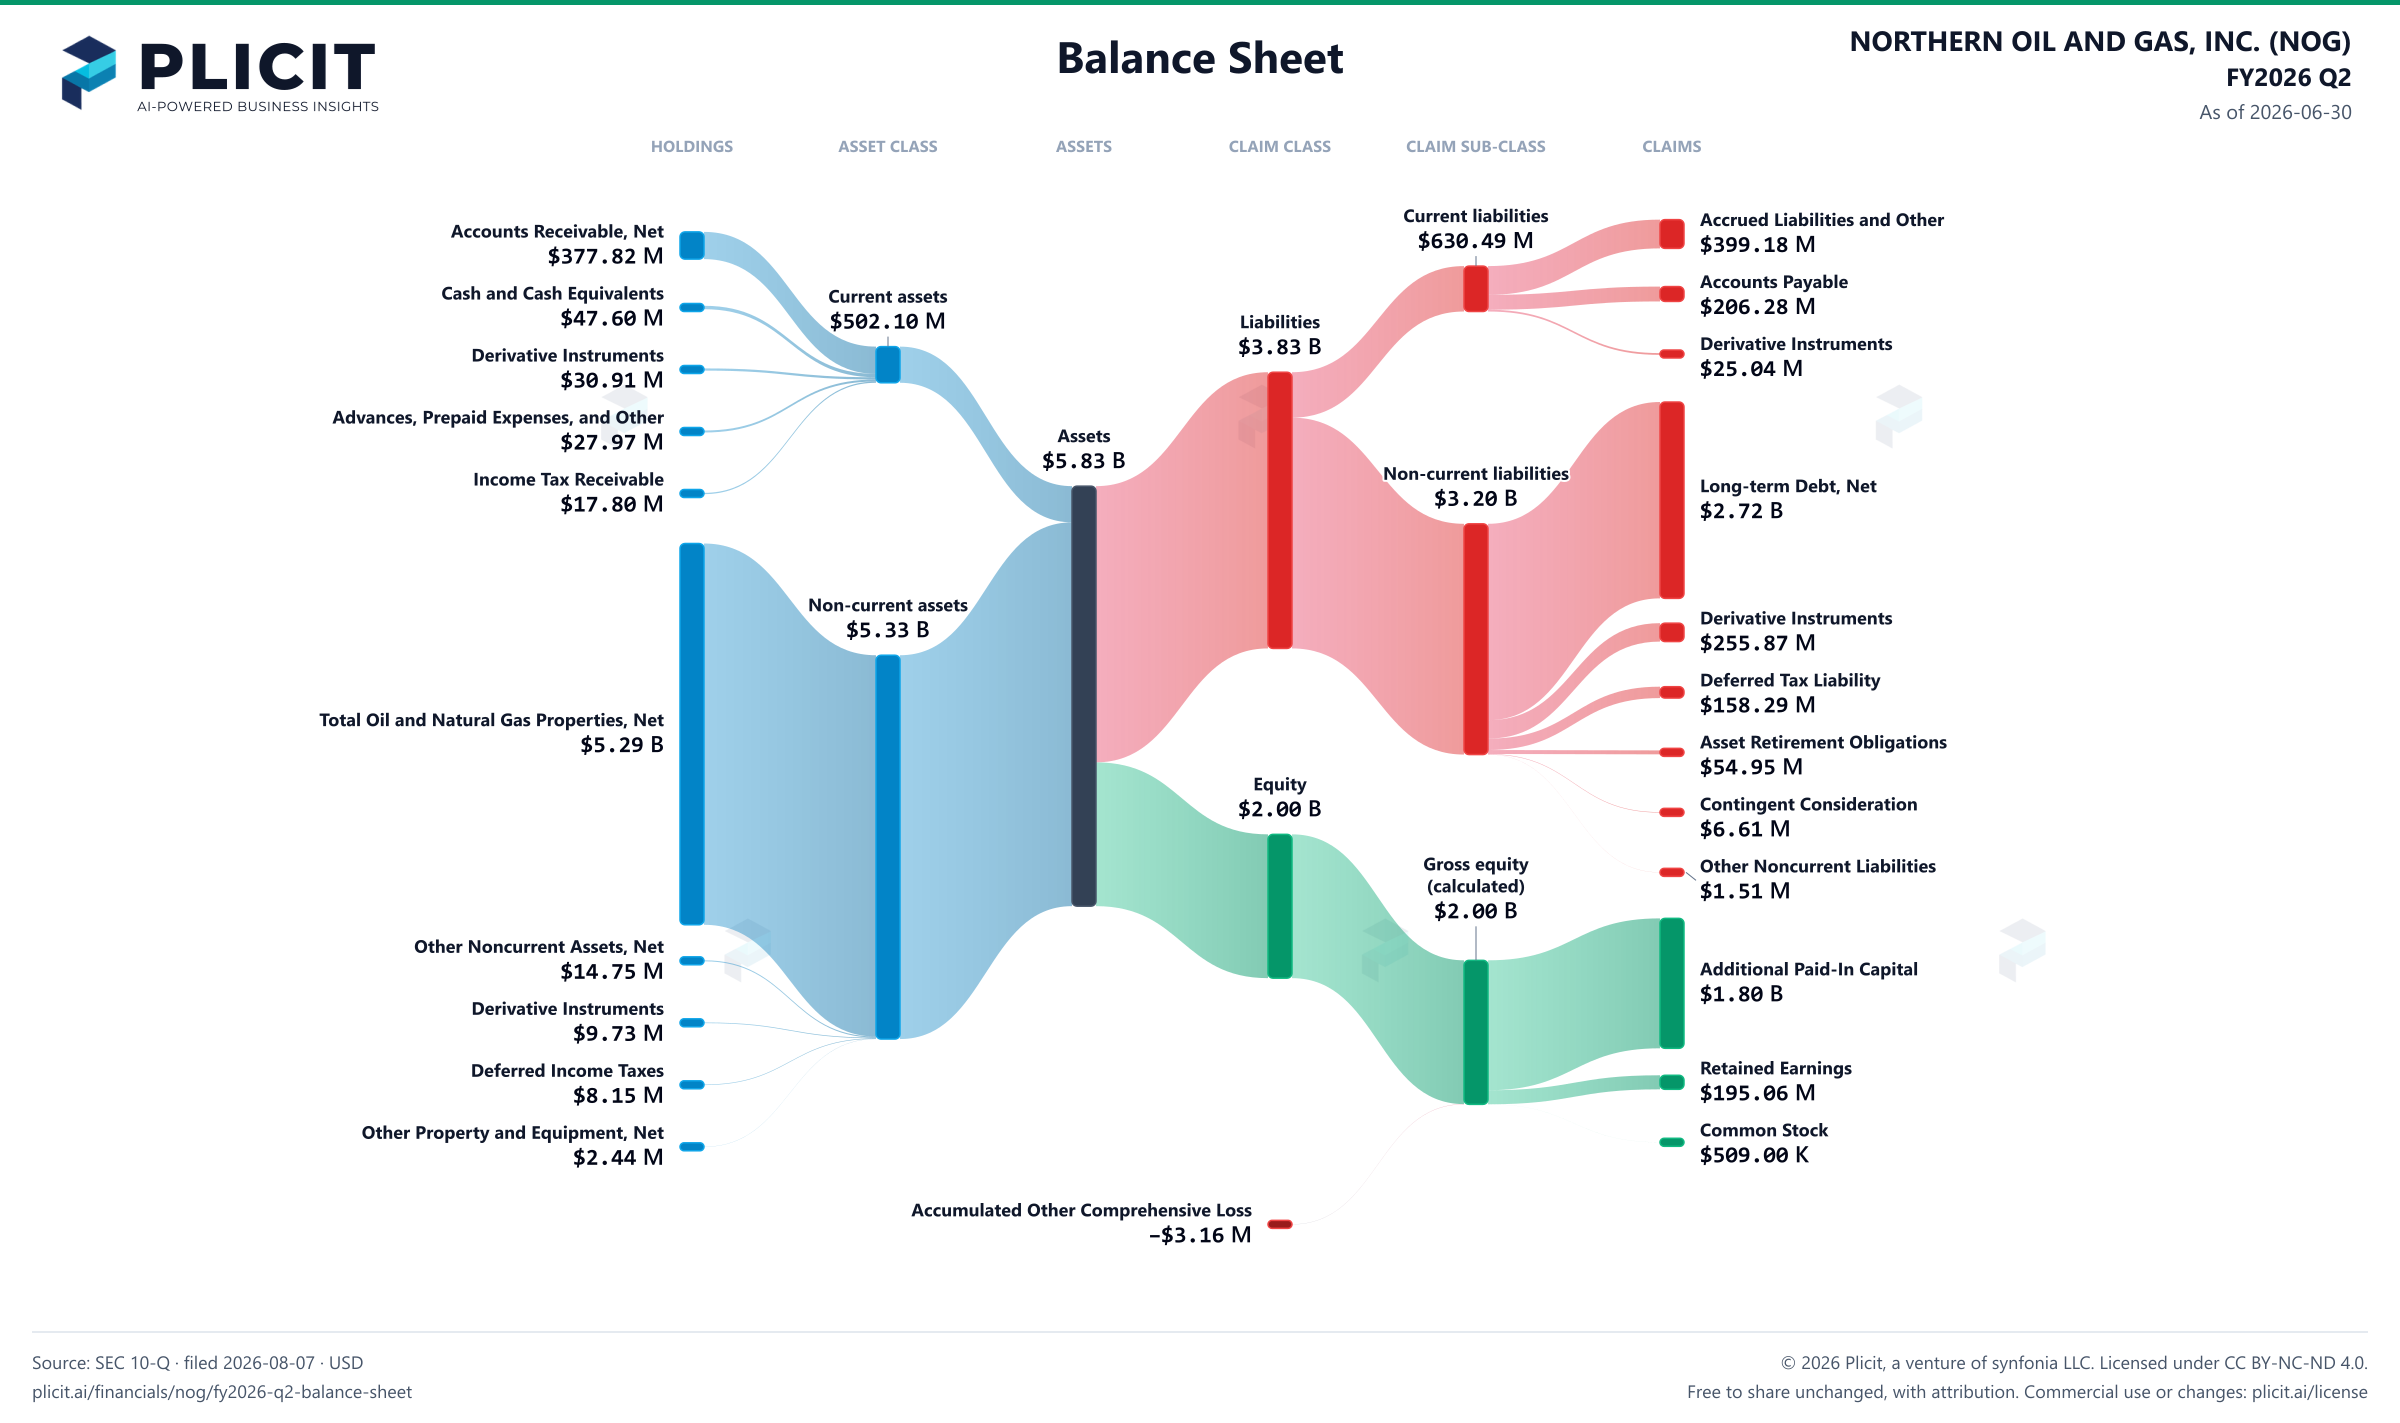
Balance sheet as of 2026-06-30. The chart shows assets, liabilities and equity at that date.
- Assets
- 5,827,865,000 US dollars
- Current assets
- 502,102,000 US dollars
- Non-current assets
- 5,325,763,000 US dollars
- Liabilities
- 3,832,532,000 US dollars
- Current liabilities
- 630,492,000 US dollars
- Non-current liabilities
- 3,202,040,000 US dollars
- Equity
- 1,995,333,000 US dollars
- Proved
- 12,429,203,000 US dollars. Part of Total Oil and Natural Gas Properties, Net, drawn as one net amount.
- Unproved
- 301,755,000 US dollars. Part of Total Oil and Natural Gas Properties, Net, drawn as one net amount.
- Less – Accumulated Depletion and Impairment
- negative 7,440,256,000 US dollars. Part of Total Oil and Natural Gas Properties, Net, drawn as one net amount.
- Accounts Receivable, Net
- 377,818,000 US dollars
- Cash and Cash Equivalents
- 47,603,000 US dollars
- Derivative Instruments
- 30,914,000 US dollars
- Advances, Prepaid Expenses, and Other
- 27,968,000 US dollars
- Income Tax Receivable
- 17,799,000 US dollars
- Total Oil and Natural Gas Properties, Net
- 5,290,702,000 US dollars
- Other Noncurrent Assets, Net
- 14,745,000 US dollars
- Derivative Instruments
- 9,726,000 US dollars
- Deferred Income Taxes
- 8,152,000 US dollars
- Other Property and Equipment, Net
- 2,438,000 US dollars
- Accrued Liabilities and Other
- 399,176,000 US dollars
- Accounts Payable
- 206,275,000 US dollars
- Derivative Instruments
- 25,041,000 US dollars
- Long-term Debt, Net
- 2,724,814,000 US dollars
- Derivative Instruments
- 255,868,000 US dollars
- Deferred Tax Liability
- 158,290,000 US dollars
- Asset Retirement Obligations
- 54,949,000 US dollars
- Contingent Consideration
- 6,614,000 US dollars
- Other Noncurrent Liabilities
- 1,505,000 US dollars
- Additional Paid-In Capital
- 1,802,928,000 US dollars
- Retained Earnings
- 195,060,000 US dollars
- Common Stock, Par Value $0.001; 270,000,000 Shares Authorized; 106,549,128 Shares Outstanding at 6/30/2026 97,265,559 Shares Outstanding at 12/31/2025
- 509,000 US dollars
- Accumulated Other Comprehensive Loss
- negative 3,164,000 US dollars
- Gross equity (calculated)
- 1,998,497,000 US dollars. Net equity plus the magnitudes of its negative contributions equals gross positive equity. The negative contributions enter this reconciliation as add-backs; their filed signs stay negative.
Chart connections
- Assets equal liabilities plus consolidated equity. Consolidated equity includes noncontrolling interests when reported.
- Treasury shares and other negative equity contributions reduce equity.
Free to share unchanged, with credit to Plicit.ai · CC BY-NC-ND 4.0Download PNG
Product waitlist
Health Check and Teardown for your own company
A health check uncovers insights of your private books, not a public ticker. Join this list to get notified as soon as we go-live!