
SERVICENOW, INC. (NOW) FY2025 Q1 Balance Sheet
As of 2025-03-31
Balance Sheet
As of 2025-03-31
Swipe to see the full flow
Chart details
SERVICENOW, INC. (NOW) FY2025 Q1 Balance Sheet
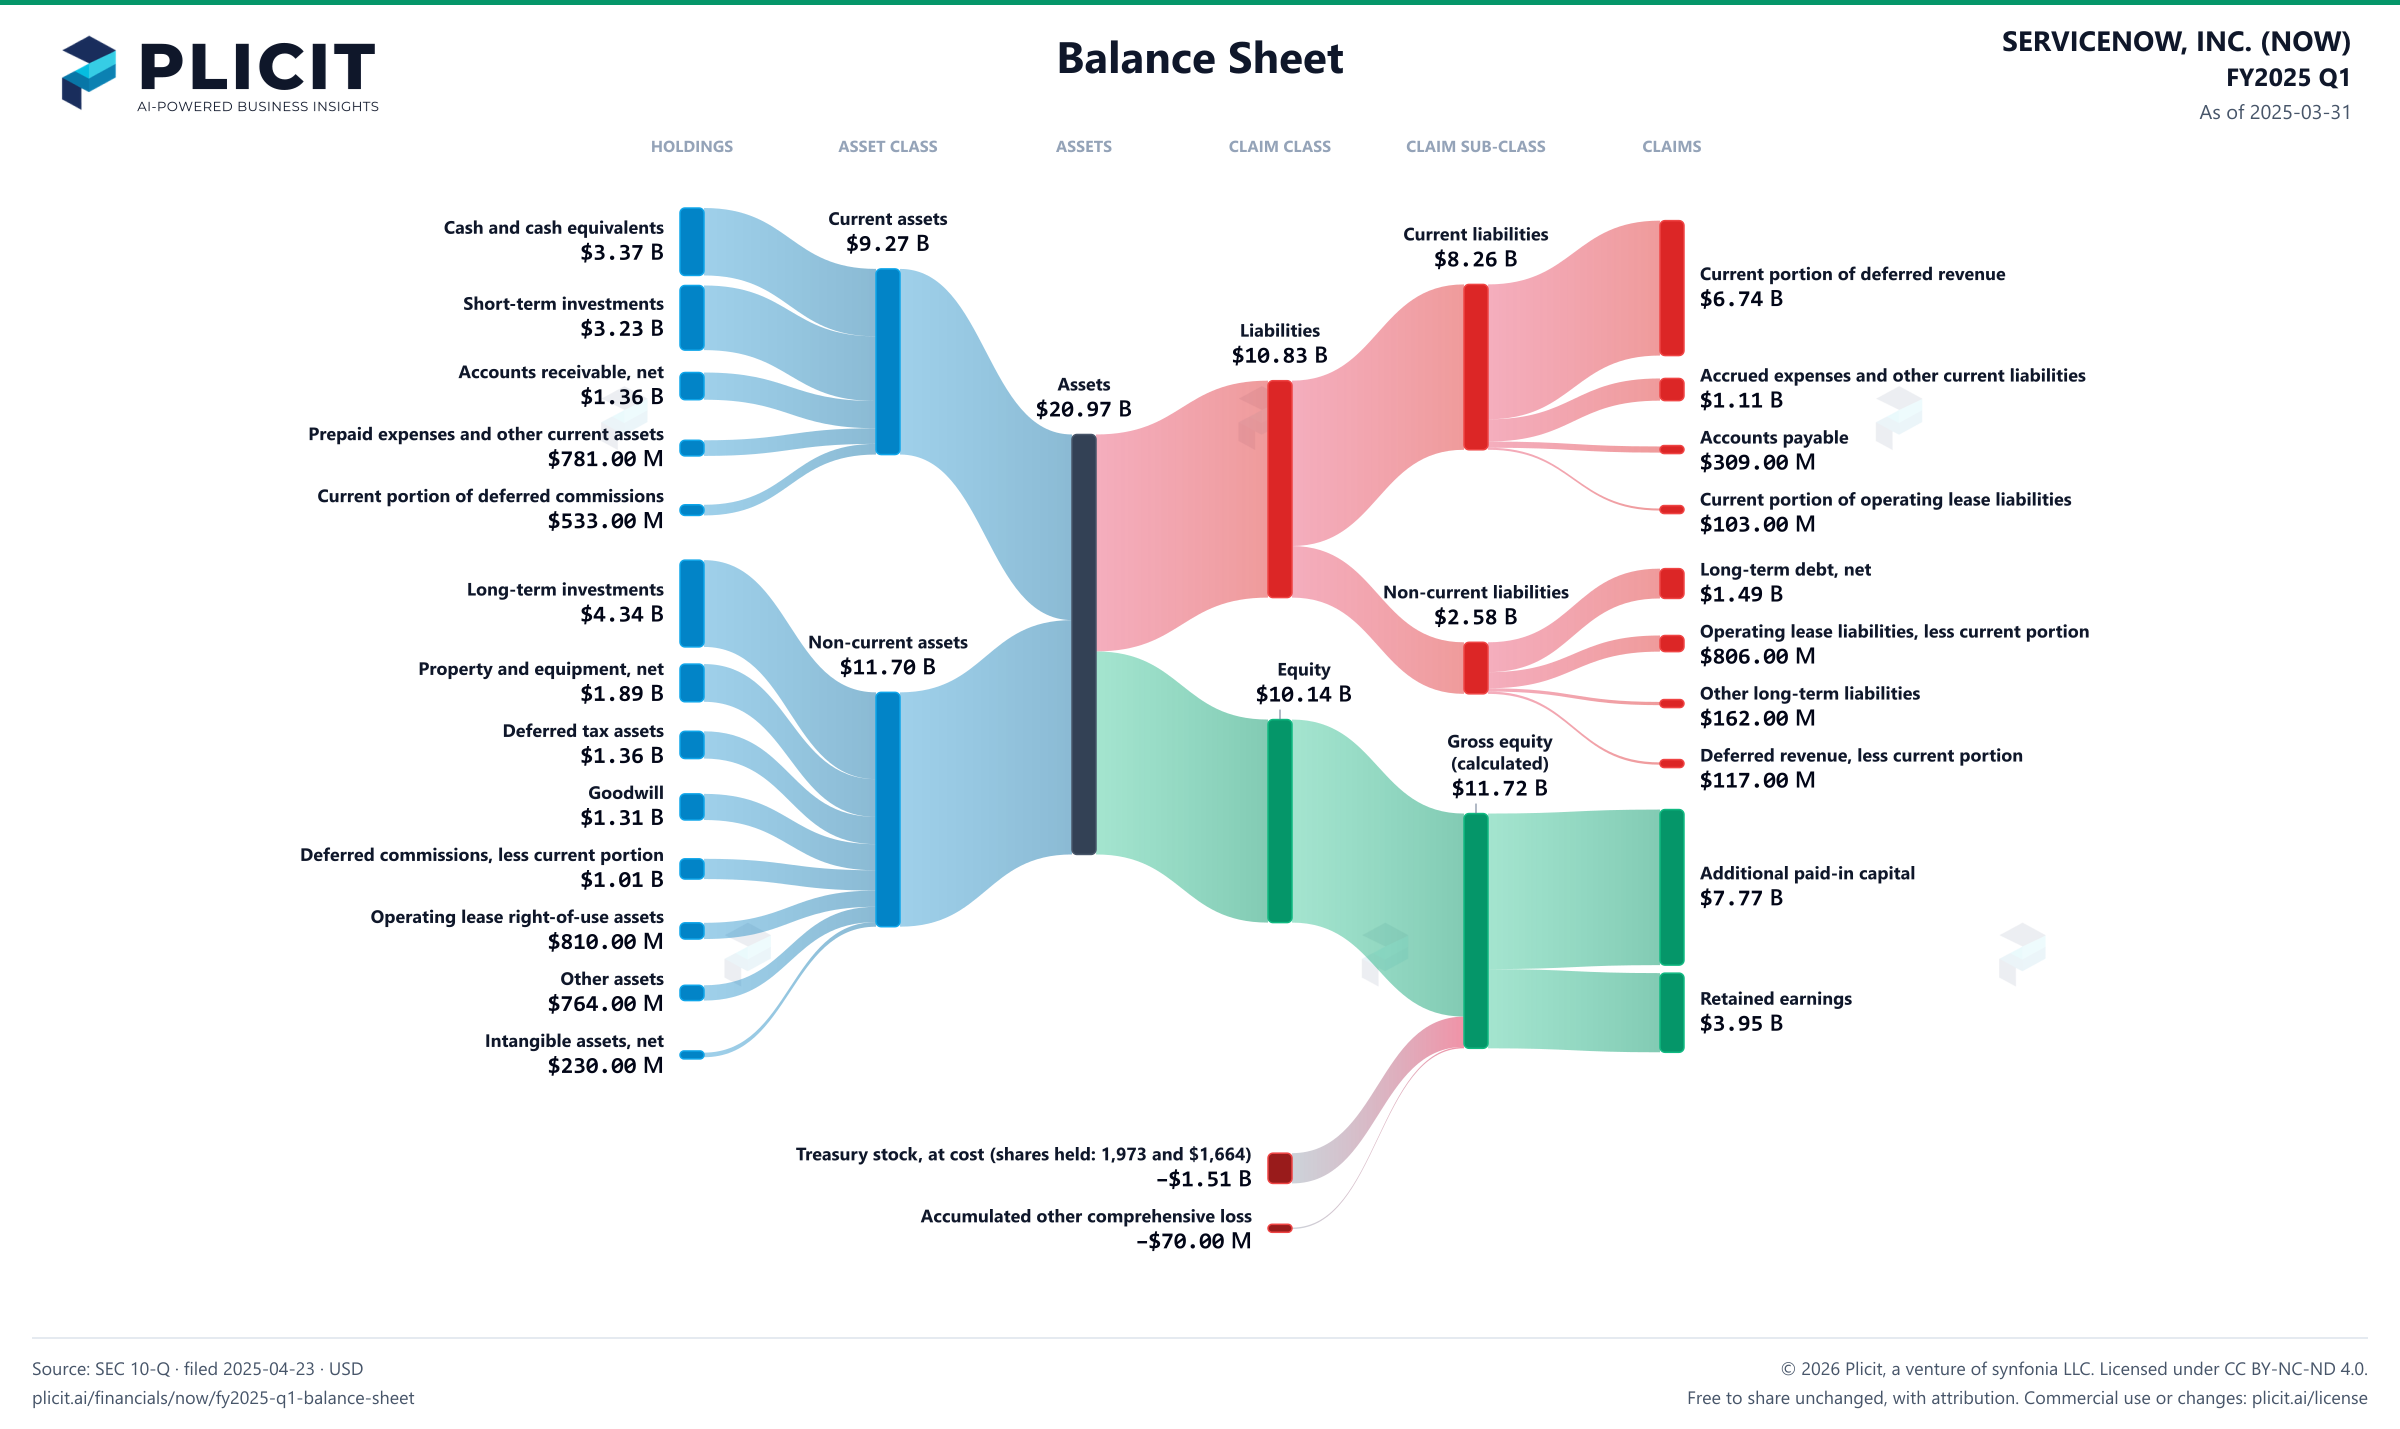
Balance sheet as of 2025-03-31. The chart shows assets, liabilities and equity at that date.
- Assets
- 20,972,000,000 US dollars
- Current assets
- 9,270,000,000 US dollars
- Non-current assets
- 11,702,000,000 US dollars
- Liabilities
- 10,833,000,000 US dollars
- Current liabilities
- 8,258,000,000 US dollars
- Non-current liabilities
- 2,575,000,000 US dollars
- Equity
- 10,139,000,000 US dollars
- Cash and cash equivalents
- 3,369,000,000 US dollars
- Short-term investments
- 3,228,000,000 US dollars
- Accounts receivable, net
- 1,359,000,000 US dollars
- Prepaid expenses and other current assets
- 781,000,000 US dollars
- Current portion of deferred commissions
- 533,000,000 US dollars
- Long-term investments
- 4,335,000,000 US dollars
- Property and equipment, net
- 1,885,000,000 US dollars
- Deferred tax assets
- 1,361,000,000 US dollars
- Goodwill
- 1,305,000,000 US dollars
- Deferred commissions, less current portion
- 1,012,000,000 US dollars
- Operating lease right-of-use assets
- 810,000,000 US dollars
- Other assets
- 764,000,000 US dollars
- Intangible assets, net
- 230,000,000 US dollars
- Current portion of deferred revenue
- 6,737,000,000 US dollars
- Accrued expenses and other current liabilities
- 1,109,000,000 US dollars
- Accounts payable
- 309,000,000 US dollars
- Current portion of operating lease liabilities
- 103,000,000 US dollars
- Long-term debt, net
- 1,490,000,000 US dollars
- Operating lease liabilities, less current portion
- 806,000,000 US dollars
- Other long-term liabilities
- 162,000,000 US dollars
- Deferred revenue, less current portion
- 117,000,000 US dollars
- Additional paid-in capital
- 7,768,000,000 US dollars
- Retained earnings
- 3,954,000,000 US dollars
- Preferred stock, $0.001 par value; 10,000 shares authorized; no shares issued or outstanding
- 0 US dollars
- Common stock, $0.001 par value; shares authorized: 600,000; shares issued: 208,952 and 208,151; shares outstanding: 206,979 and 206,487
- 0 US dollars
- Treasury stock, at cost (shares held: 1,973 and $1,664)
- negative 1,513,000,000 US dollars
- Accumulated other comprehensive loss
- negative 70,000,000 US dollars
- Gross equity (calculated)
- 11,722,000,000 US dollars. Net equity plus the magnitudes of its negative contributions equals gross positive equity. The negative contributions enter this reconciliation as add-backs; their filed signs stay negative.
Chart connections
- Assets equal liabilities plus consolidated equity. Consolidated equity includes noncontrolling interests when reported.
- Treasury shares and other negative equity contributions reduce equity.
Free to share unchanged, with credit to Plicit.ai · CC BY-NC-ND 4.0Download PNG
Product waitlist
Health Check and Teardown for your own company
A health check uncovers insights of your private books, not a public ticker. Join this list to get notified as soon as we go-live!