
NRG Energy, Inc (NRG) FY2026 Q2 Balance Sheet
As of 2026-06-30
Balance Sheet
As of 2026-06-30
Swipe to see the full flow
Chart details
NRG Energy, Inc (NRG) FY2026 Q2 Balance Sheet
Balance sheet as of 2026-06-30. The chart shows assets, liabilities and equity at that date.
- Assets
- 39,940,000,000 US dollars
- Current assets
- 9,653,000,000 US dollars
- Non-current assets
- 30,287,000,000 US dollars
- Liabilities
- 35,085,000,000 US dollars
- Current liabilities
- 9,975,000,000 US dollars
- Non-current liabilities
- 25,110,000,000 US dollars
- Equity
- 4,855,000,000 US dollars
- Accounts receivable, net
- 3,534,000,000 US dollars
- Derivative instruments
- 3,188,000,000 US dollars
- Prepayments and other current assets
- 1,318,000,000 US dollars
- Inventory
- 793,000,000 US dollars
- Cash collateral paid in support of energy risk management activities
- 441,000,000 US dollars
- Funds deposited by counterparties
- 167,000,000 US dollars
- Cash and cash equivalents
- 162,000,000 US dollars
- Restricted cash
- 50,000,000 US dollars
- Property, plant and equipment, net
- 14,076,000,000 US dollars
- Goodwill
- 8,815,000,000 US dollars
- Other non-current assets
- 1,772,000,000 US dollars
- Deferred income taxes
- 1,725,000,000 US dollars
- Derivative instruments
- 1,617,000,000 US dollars
- Intangible assets, net - Customer relationships, net
- 1,177,000,000 US dollars
- Intangible assets, net - Other intangible assets, net
- 963,000,000 US dollars
- Operating lease right-of-use assets, net
- 142,000,000 US dollars
- Derivative instruments
- 3,120,000,000 US dollars
- Accounts payable
- 2,579,000,000 US dollars
- Accrued expenses and other current liabilities
- 1,719,000,000 US dollars
- Current portion of long-term debt and finance leases
- 1,512,000,000 US dollars
- Deferred revenue current
- 837,000,000 US dollars
- Cash collateral received in support of energy risk management activities
- 167,000,000 US dollars
- Current portion of operating lease liabilities
- 41,000,000 US dollars
- Long-term debt and finance leases
- 21,744,000,000 US dollars
- Derivative instruments
- 1,327,000,000 US dollars
- Deferred revenue non-current
- 984,000,000 US dollars
- Other non-current liabilities
- 870,000,000 US dollars
- Non-current operating lease liabilities
- 170,000,000 US dollars
- Deferred income taxes
- 15,000,000 US dollars
- Additional paid-in-capital
- 3,880,000,000 US dollars
- Retained earnings
- 2,374,000,000 US dollars
- Preferred stock; 10,000,000 shares authorized; 650,000 Series A shares issued and outstanding at June 30, 2026 and December 31, 2025, aggregate liquidation preference of $650 at June 30, 2026 and December 31, 2025
- 650,000,000 US dollars
- Common stock; $0.01 par value; 500,000,000 shares authorized; 225,198,900 and 199,828,615 shares issued and 210,307,902 and 190,376,607 shares outstanding at June 30, 2026 and December 31, 2025, respectively
- 2,000,000 US dollars
- Treasury stock, at cost; 14,890,998 shares and 9,452,008 shares at June 30, 2026 and December 31, 2025, respectively
- negative 1,964,000,000 US dollars
- Accumulated other comprehensive loss
- negative 87,000,000 US dollars
- Gross equity (calculated)
- 6,906,000,000 US dollars. Net equity plus the magnitudes of its negative contributions equals gross positive equity. The negative contributions enter this reconciliation as add-backs; their filed signs stay negative.
Chart connections
- Assets equal liabilities plus consolidated equity. Consolidated equity includes noncontrolling interests when reported.
- Treasury shares and other negative equity contributions reduce equity.
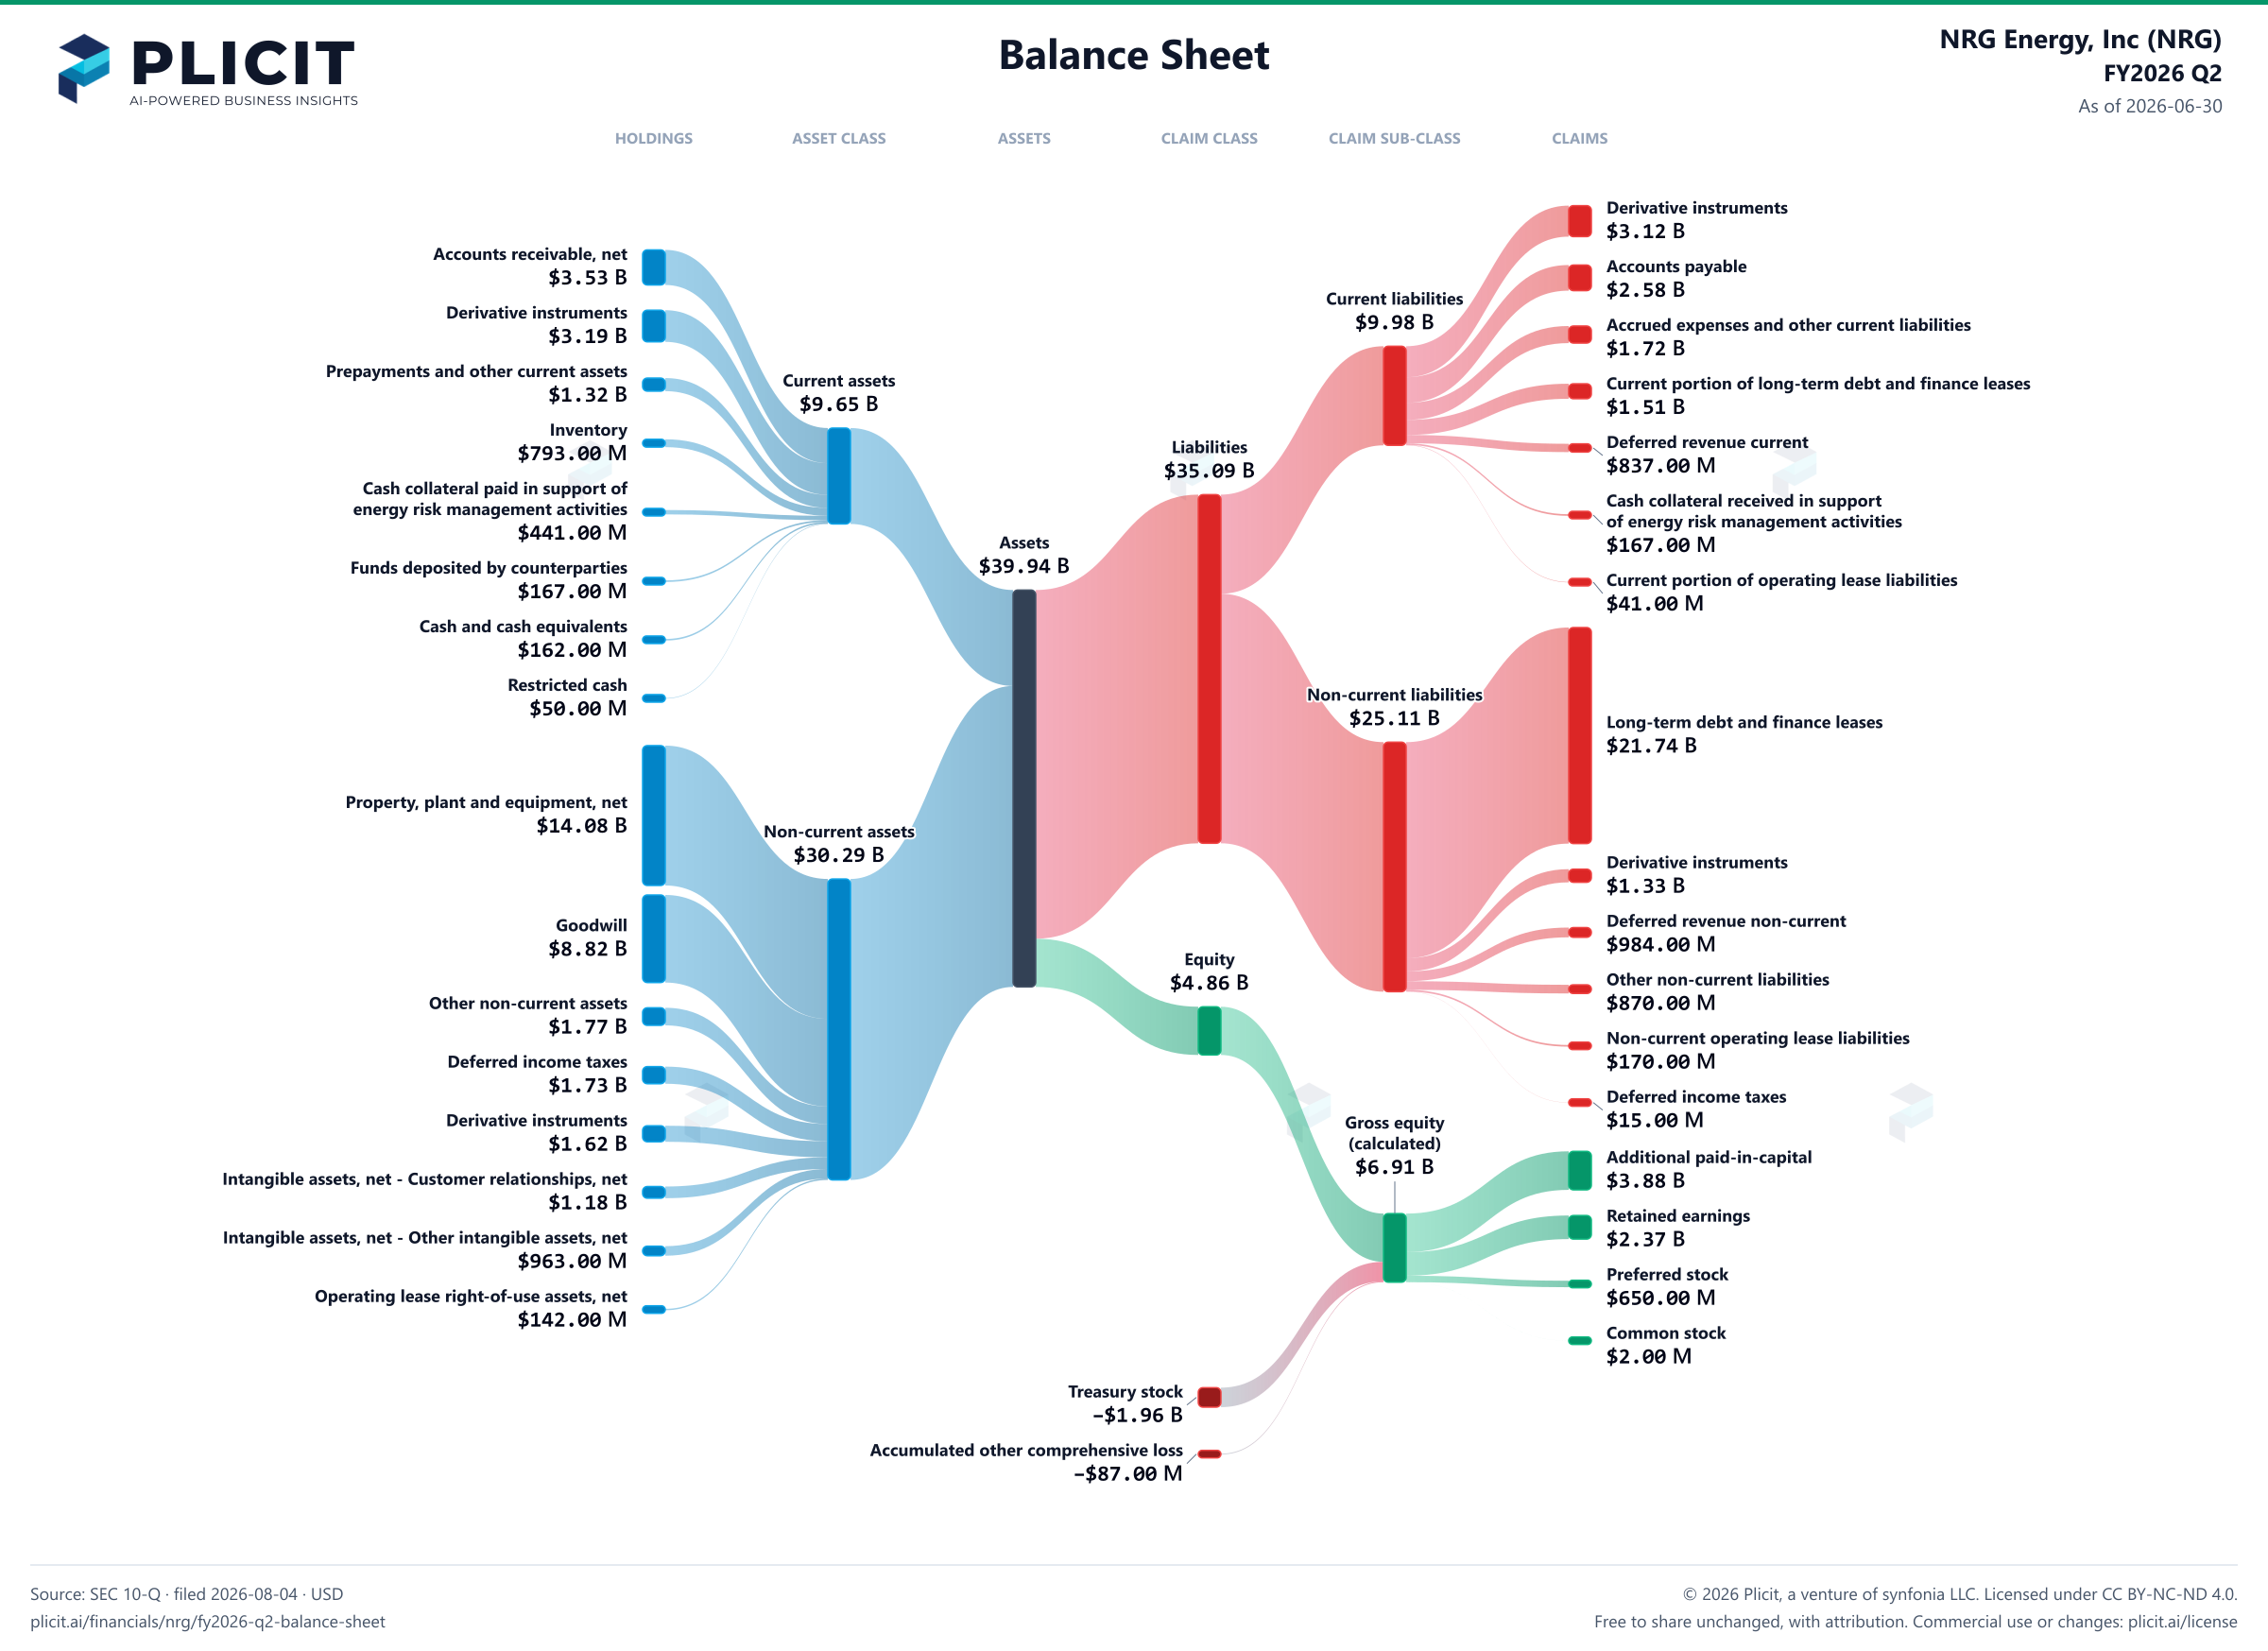
Free to share unchanged, with credit to Plicit.ai · CC BY-NC-ND 4.0Download PNG
Product waitlist
Health Check and Teardown for your own company
A health check uncovers insights of your private books, not a public ticker. Join this list to get notified as soon as we go-live!