
NETSCOUT SYSTEMS, INC. (NTCT) FY2026 Q1 Balance Sheet

Balance Sheet

As of 2026-06-30

Swipe to see the full flow
NETSCOUT SYSTEMS, INC. (NTCT) FY2026 Q1 Balance SheetBalance sheet as of 2026-06-30. The chart shows assets, liabilities and equity at that date.Current liabilities$423.12 MLiabilities$647.81 MCurrent assets$772.26 MNon-current liabilities$224.70 MAssets$2.31 BEquity$1.66 BGross equity(calculated)$3.42 BNon-current assets$1.54 BHOLDINGSASSET CLASSASSETSCLAIM CLASSCLAIM SUB-CLASSCLAIMSCash and cash equivalentsAccounts receivable and unbilled costs, net of allowance for doubtful accounts of $80 and $129 at June 30, 2026 and March 31, 2026, respectivelyMarketable securitiesPrepaid expenses and other current assetsInventories and deferred costsPrepaid income taxesGoodwillIntangible assets, netDeferred income taxesLong-term marketable securitiesOperating lease right-of-use assetsFixed assets, netOther assetsDeferred revenue and customer depositsAccrued compensationAccounts payableAccrued otherCurrent portion of operating lease liabilitiesIncome taxes payableLong-term deferred revenue and customer depositsOperating lease liabilities, net of current portionAccrued long-term retirement benefitsOther long-term liabilitiesDeferred tax liabilityAdditional paid-in capitalRetained earningsAccumulated other comprehensive incomeCommon stock, $0.001 par value: 300,000,000 authorized; 138,474,142 and 136,628,693 issued and 72,700,450 and 71,464,664 outstandingCurrent assetsNon-current assetsAssetsCurrent liabilitiesNon-current liabilitiesLiabilitiesEquityGross equity (calculated)Treasury stock at cost, 65,773,692 and 65,164,029Deferred revenue and customer depositsDeferred revenue and customer deposits$313.33 MAccrued compensationAccrued compensation$61.16 MCurrent liabilitiesCurrent liabilities$423.12 MAccounts payableAccounts payable$23.54 MAccrued otherAccrued other$13.45 MLiabilitiesLiabilities$647.81 MCurrent portion of operating lease liabilitiesCurrent portion of operating lease liabilities$10.84 MCash and cash equivalentsCash and cash equivalents$552.83 MIncome taxes payableIncome taxes payable$805.00 KCurrent assetsCurrent assets$772.26 MAccounts receivable and unbilled costs, net of allowance for doubtful accounts of $80 and $129 at June 30, 2026 and March 31, 2026, respectivelyAccounts receivable and unbilled costs, net$79.97 MLong-term deferred revenue and customer depositsLong-term deferred revenue and customer deposits$159.00 MMarketable securitiesMarketable securities$76.58 MNon-current liabilitiesNon-current liabilities$224.70 MOperating lease liabilities, net of current portionOperating lease liabilities, net of current portion$29.14 MAssetsAssets$2.31 BPrepaid expenses and other current assetsPrepaid expenses and other current assets$25.88 MAccrued long-term retirement benefitsAccrued long-term retirement benefits$27.94 MInventories and deferred costsInventories and deferred costs$20.91 MOther long-term liabilitiesOther long-term liabilities$6.43 MPrepaid income taxesPrepaid income taxes$16.10 MEquityEquity$1.66 BDeferred tax liabilityDeferred tax liability$2.19 MGross equity (calculated)Gross equity(calculated)$3.42 BNon-current assetsNon-current assets$1.54 BGoodwillGoodwill$1.10 BIntangible assets, netIntangible assets, net$226.73 MDeferred income taxesDeferred income taxes$99.22 MAdditional paid-in capitalAdditional paid-in capital$3.34 BLong-term marketable securitiesLong-term marketable securities$39.06 MOperating lease right-of-use assetsOperating lease right-of-use assets$36.03 MFixed assets, netFixed assets, net$26.16 MOther assetsOther assets$14.79 MRetained earningsRetained earnings$72.92 MAccumulated other comprehensive incomeAccumulated other comprehensive income$3.89 MCommon stock, $0.001 par value: 300,000,000 authorized; 138,474,142 and 136,628,693 issued and 72,700,450 and 71,464,664 outstandingCommon stock$138.00 KTreasury stock at cost, 65,773,692 and 65,164,029Treasury stock at cost, 65,773,692 and 65,164,029−$1.76 B
Chart details

NETSCOUT SYSTEMS, INC. (NTCT) FY2026 Q1 Balance Sheet

Balance sheet as of 2026-06-30. The chart shows assets, liabilities and equity at that date.

Assets
2,310,838,000 US dollars
Current assets
772,258,000 US dollars
Non-current assets
1,538,580,000 US dollars
Liabilities
647,814,000 US dollars
Current liabilities
423,117,000 US dollars
Non-current liabilities
224,697,000 US dollars
Equity
1,663,024,000 US dollars
Cash and cash equivalents
552,828,000 US dollars
Accounts receivable and unbilled costs, net of allowance for doubtful accounts of $80 and $129 at June 30, 2026 and March 31, 2026, respectively
79,966,000 US dollars
Marketable securities
76,583,000 US dollars
Prepaid expenses and other current assets
25,877,000 US dollars
Inventories and deferred costs
20,909,000 US dollars
Prepaid income taxes
16,095,000 US dollars
Goodwill
1,096,593,000 US dollars
Intangible assets, net
226,733,000 US dollars
Deferred income taxes
99,219,000 US dollars
Long-term marketable securities
39,062,000 US dollars
Operating lease right-of-use assets
36,026,000 US dollars
Fixed assets, net
26,158,000 US dollars
Other assets
14,789,000 US dollars
Deferred revenue and customer deposits
313,327,000 US dollars
Accrued compensation
61,162,000 US dollars
Accounts payable
23,536,000 US dollars
Accrued other
13,451,000 US dollars
Current portion of operating lease liabilities
10,836,000 US dollars
Income taxes payable
805,000 US dollars
Long-term deferred revenue and customer deposits
158,996,000 US dollars
Operating lease liabilities, net of current portion
29,144,000 US dollars
Accrued long-term retirement benefits
27,938,000 US dollars
Other long-term liabilities
6,430,000 US dollars
Deferred tax liability
2,189,000 US dollars
Additional paid-in capital
3,342,802,000 US dollars
Retained earnings
72,923,000 US dollars
Accumulated other comprehensive income
3,893,000 US dollars
Common stock, $0.001 par value: 300,000,000 authorized; 138,474,142 and 136,628,693 issued and 72,700,450 and 71,464,664 outstanding
138,000 US dollars
Preferred stock, $0.001 par value: 5,000,000 authorized; none issued or outstanding
0 US dollars
Treasury stock at cost, 65,773,692 and 65,164,029
negative 1,756,732,000 US dollars
Gross equity (calculated)
3,419,756,000 US dollars. Net equity plus the magnitudes of its negative contributions equals gross positive equity. The negative contributions enter this reconciliation as add-backs; their filed signs stay negative.

Chart connections

  • Assets equal liabilities plus consolidated equity. Consolidated equity includes noncontrolling interests when reported.
  • Treasury shares and other negative equity contributions reduce equity.
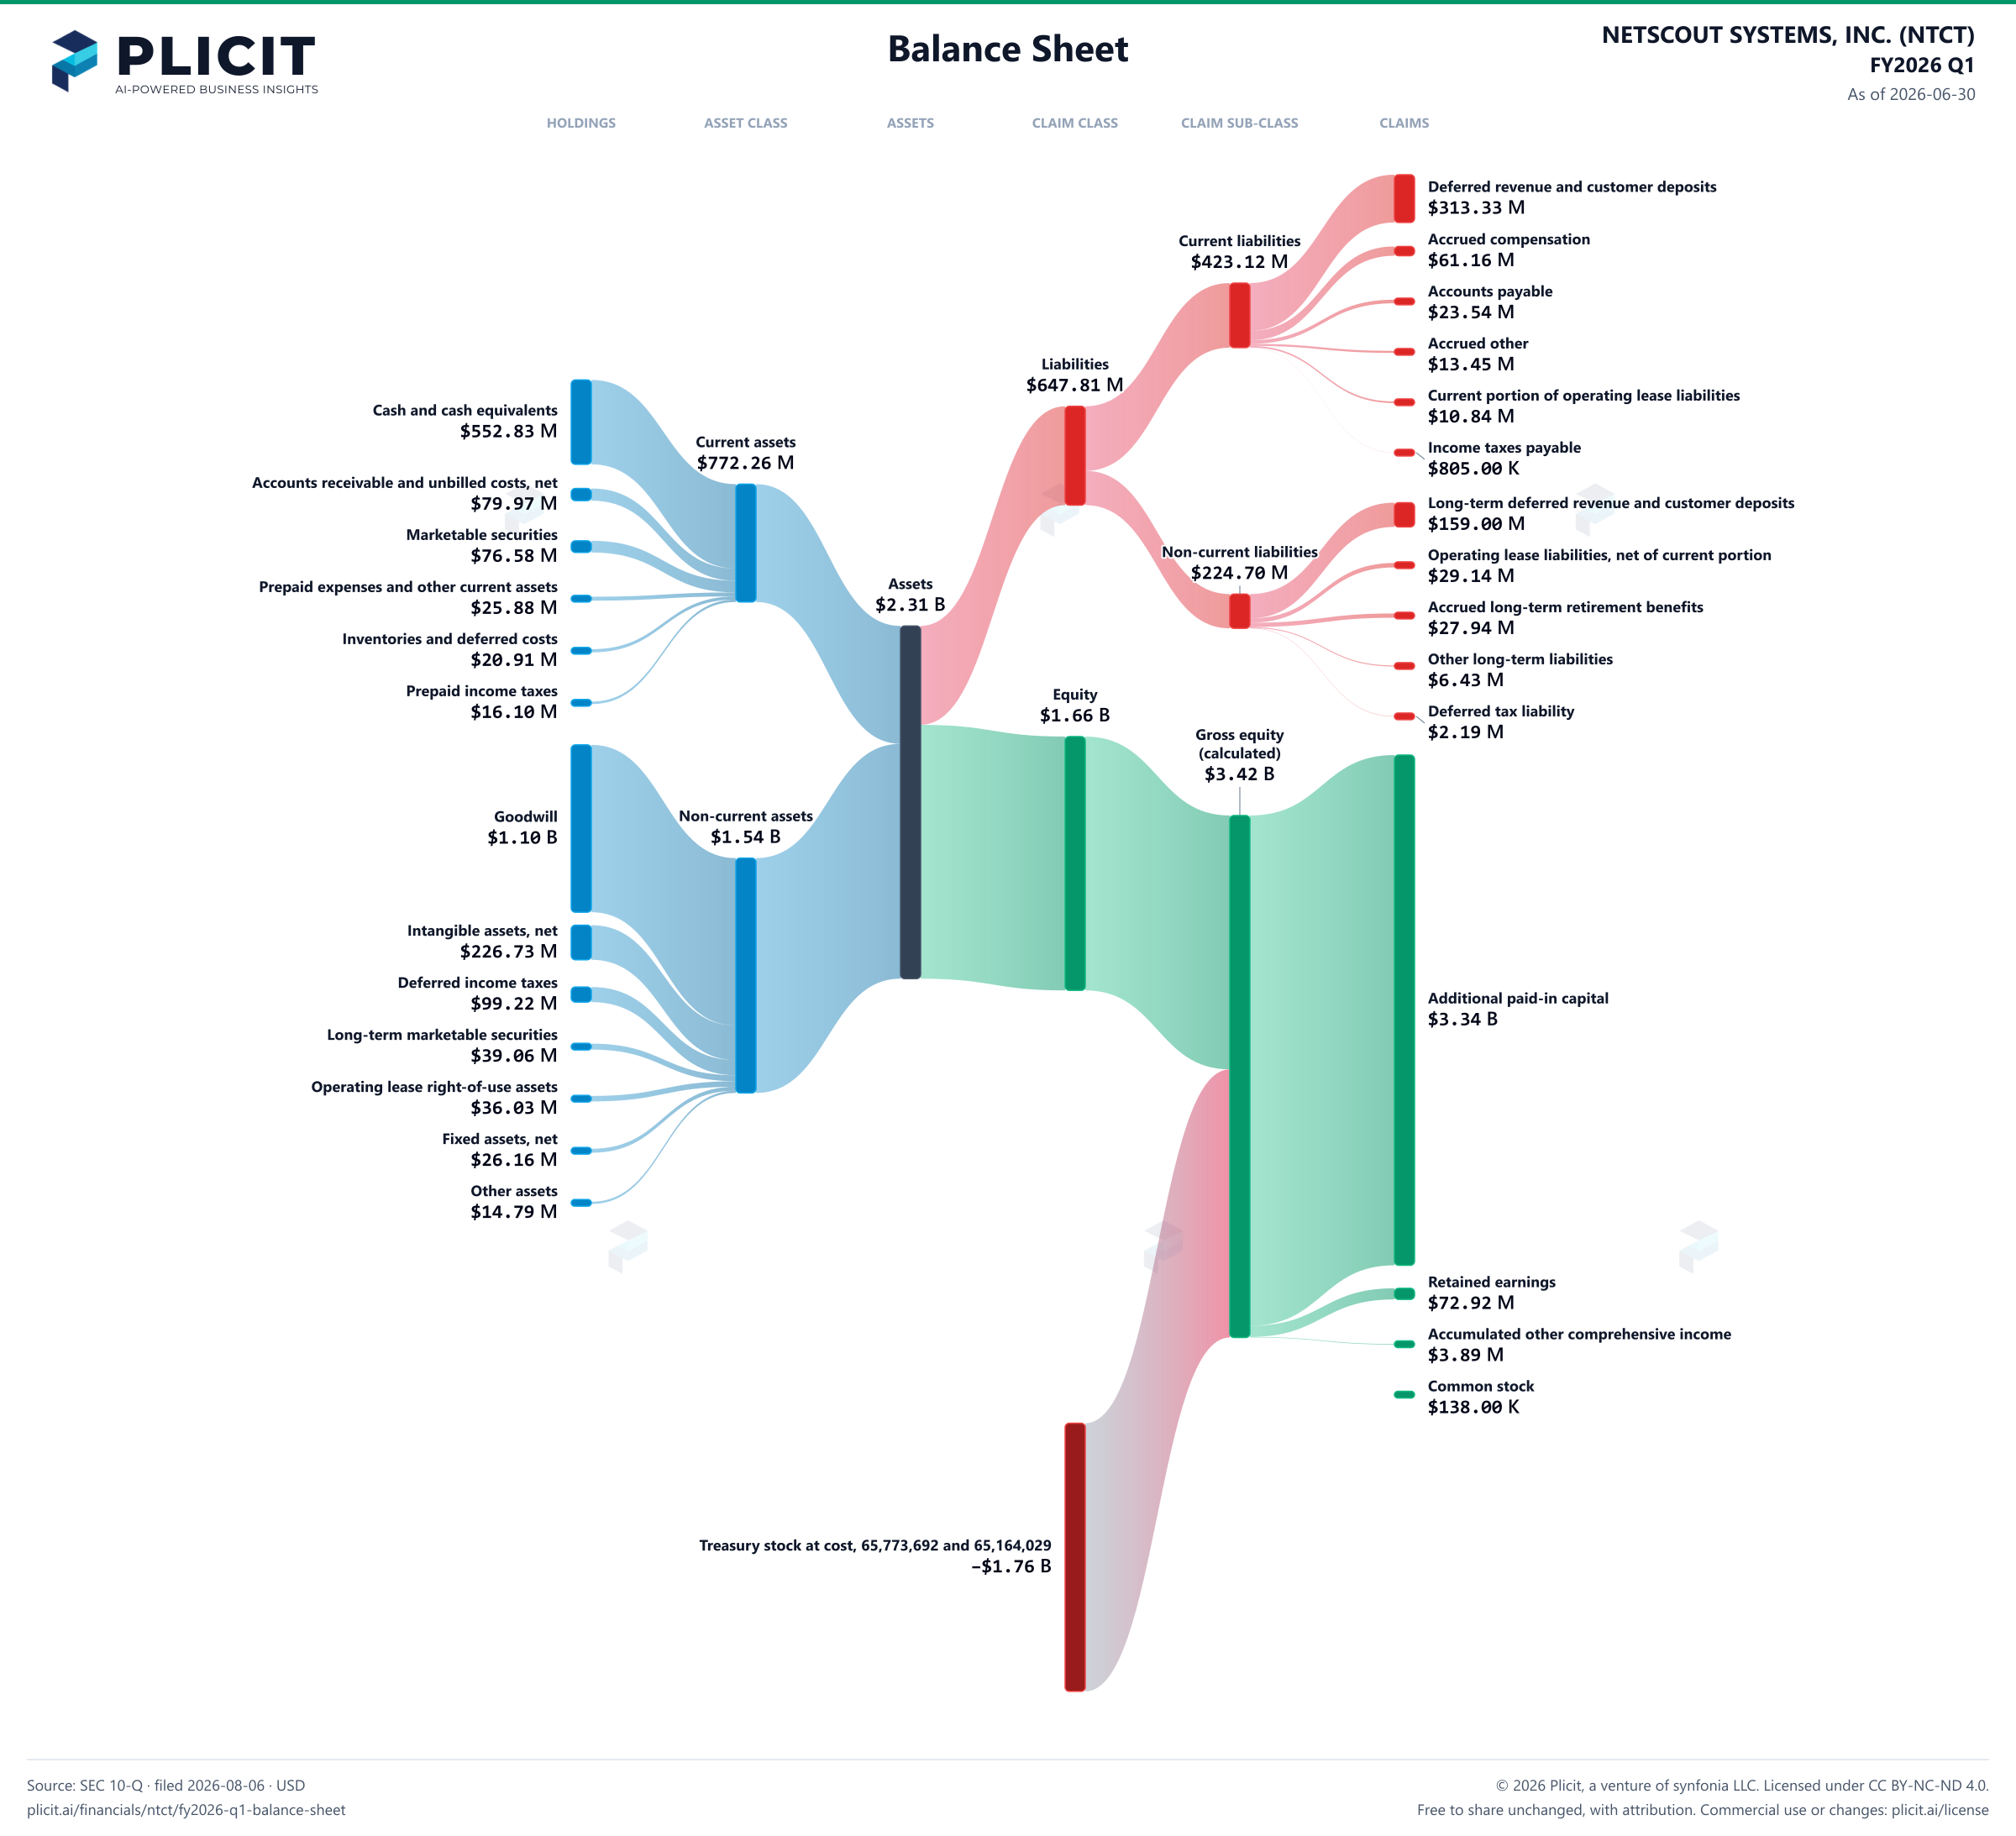
NETSCOUT SYSTEMS, INC. (NTCT) FY2026 Q1 Balance Sheet Sankey chart
Free to share unchanged, with credit to Plicit.ai · CC BY-NC-ND 4.0Download PNG

Newsletter

Get the teardowns by email

Subscribe if you want the public-company teardowns in your inbox when they're released.

Product waitlist

Health Check and Teardown for your own company

A health check uncovers insights of your private books, not a public ticker. Join this list to get notified as soon as we go-live!