
NETSOL TECHNOLOGIES, INC. (NTWK) FY2026 Annual Balance Sheet

Balance Sheet

As of 2026-06-30

Swipe to see the full flow
NETSOL TECHNOLOGIES, INC. (NTWK) FY2026 Annual Balance SheetBalance sheet as of 2026-06-30. The chart shows assets, liabilities and equity at that date.Current liabilities$27.63 MLiabilities$28.27 MCurrent assets$56.86 MNon-current liabilities$641.47 KEquity$49.57 MAssets$77.84 MGross equity(calculated)$138.29 MNon-current assets$20.98 MHOLDINGSASSET CLASSASSETSCLAIM CLASSCLAIM SUB-CLASSCLAIMSCash and cash equivalentsContract assets, net of allowance of $10 and $34,496Accounts receivable, net of allowance of $48,606 and $355,464Other current assetsGoodwillProperty and equipment, netOther intangible assets, netContract assets, net - non-currentRight of use assets - operating leasesOther assetsContract liabilitiesAccounts payable and accrued expensesCurrent portion of loans and obligations under finance leasesCurrent portion of operating lease obligationsOperating lease obligations; less current maturitiesLoans and obligations under finance leases; less current maturitiesAdditional paid-in-capitalCommon stock, $.01 par value; 18,000,000 shares authorized; 12,825,028 shares issued and 11,885,997 outstanding as of June 30, 2026, 12,700,465 shares issued and 11,761,434 outstanding as of June 30, 2025Non-controlling interestCurrent assetsNon-current assetsAssetsCurrent liabilitiesNon-current liabilitiesLiabilitiesEquityGross equity (calculated)Other comprehensive lossAccumulated deficitTreasury stock (at cost, 939,031 shares as of June 30, 2026 and June 30, 2025)Current liabilitiesCurrent liabilities$27.63 MContract liabilitiesContract liabilities$10.29 MLiabilitiesLiabilities$28.27 MAccounts payable and accrued expensesAccounts payable and accrued expenses$8.71 MCurrent portion of loans and obligations under finance leasesCurrent portion of loans andobligations under finance leases$8.19 MCurrent portion of operating lease obligationsCurrent portion of operating lease obligations$447.33 KCurrent assetsCurrent assets$56.86 MNon-current liabilitiesNon-current liabilities$641.47 KOperating lease obligations; less current maturitiesOperating lease obligations; less current maturities$428.49 KEquityEquity$49.57 MCash and cash equivalentsCash and cash equivalents$27.12 MLoans and obligations under finance leases; less current maturitiesLoans and obligations under finance leases$212.98 KAssetsAssets$77.84 MGross equity (calculated)Gross equity(calculated)$138.29 MContract assets, net of allowance of $10 and $34,496Contract assets, net of allowance of $10 and $34,496$16.24 MAccounts receivable, net of allowance of $48,606 and $355,464Accounts receivable, net$10.29 MOther current assetsOther current assets$3.21 MGoodwillGoodwill$9.30 MNon-current assetsNon-current assets$20.98 MProperty and equipment, netProperty and equipment, net$5.68 MAdditional paid-in-capitalAdditional paid-in-capital$130.19 MOther intangible assets, netOther intangible assets, net$2.69 MContract assets, net - non-currentContract assets, net - non-current$2.47 MRight of use assets - operating leasesRight of use assets - operating leases$831.20 KOther assetsOther assets$7.24 KCommon stock, $.01 par value; 18,000,000 shares authorized; 12,825,028 shares issued and 11,885,997 outstanding as of June 30, 2026, 12,700,465 shares issued and 11,761,434 outstanding as of June 30, 2025Common stock$128.25 KNon-controlling interestNon-controlling interest$7.97 MOther comprehensive lossOther comprehensive loss−$46.46 MAccumulated deficitAccumulated deficit−$38.34 MTreasury stock (at cost, 939,031 shares as of June 30, 2026 and June 30, 2025)Treasury stock−$3.92 M
Chart details

NETSOL TECHNOLOGIES, INC. (NTWK) FY2026 Annual Balance Sheet

Balance sheet as of 2026-06-30. The chart shows assets, liabilities and equity at that date.

Assets
77,839,049 US dollars
Current assets
56,861,176 US dollars
Non-current assets
20,977,873 US dollars
Liabilities
28,271,229 US dollars
Current liabilities
27,629,756 US dollars
Non-current liabilities
641,473 US dollars
Equity
49,567,820 US dollars
Noncontrolling interest
7,973,895 US dollars. Included in consolidated equity; this amount is not added again.
Cash and cash equivalents
27,123,955 US dollars
Contract assets, net of allowance of $10 and $34,496
16,240,564 US dollars
Accounts receivable, net of allowance of $48,606 and $355,464
10,286,342 US dollars
Other current assets
3,210,315 US dollars
Goodwill
9,302,524 US dollars
Property and equipment, net
5,683,502 US dollars
Other intangible assets, net
2,686,392 US dollars
Contract assets, net - non-current
2,467,018 US dollars
Right of use assets - operating leases
831,196 US dollars
Other assets
7,241 US dollars
Contract liabilities
10,287,225 US dollars
Accounts payable and accrued expenses
8,708,029 US dollars
Current portion of loans and obligations under finance leases
8,187,170 US dollars
Current portion of operating lease obligations
447,332 US dollars
Operating lease obligations; less current maturities
428,491 US dollars
Loans and obligations under finance leases; less current maturities
212,982 US dollars
Additional paid-in-capital
130,188,049 US dollars
Common stock, $.01 par value; 18,000,000 shares authorized; 12,825,028 shares issued and 11,885,997 outstanding as of June 30, 2026, 12,700,465 shares issued and 11,761,434 outstanding as of June 30, 2025
128,253 US dollars
Non-controlling interest
7,973,895 US dollars
Other comprehensive loss
negative 46,462,794 US dollars
Accumulated deficit
negative 38,338,727 US dollars
Treasury stock (at cost, 939,031 shares as of June 30, 2026 and June 30, 2025)
negative 3,920,856 US dollars
Gross equity (calculated)
138,290,197 US dollars. Net equity plus the magnitudes of its negative contributions equals gross positive equity. The negative contributions enter this reconciliation as add-backs; their filed signs stay negative.

Chart connections

  • Assets equal liabilities plus consolidated equity. Consolidated equity includes noncontrolling interests when reported.
  • Treasury shares and other negative equity contributions reduce equity.
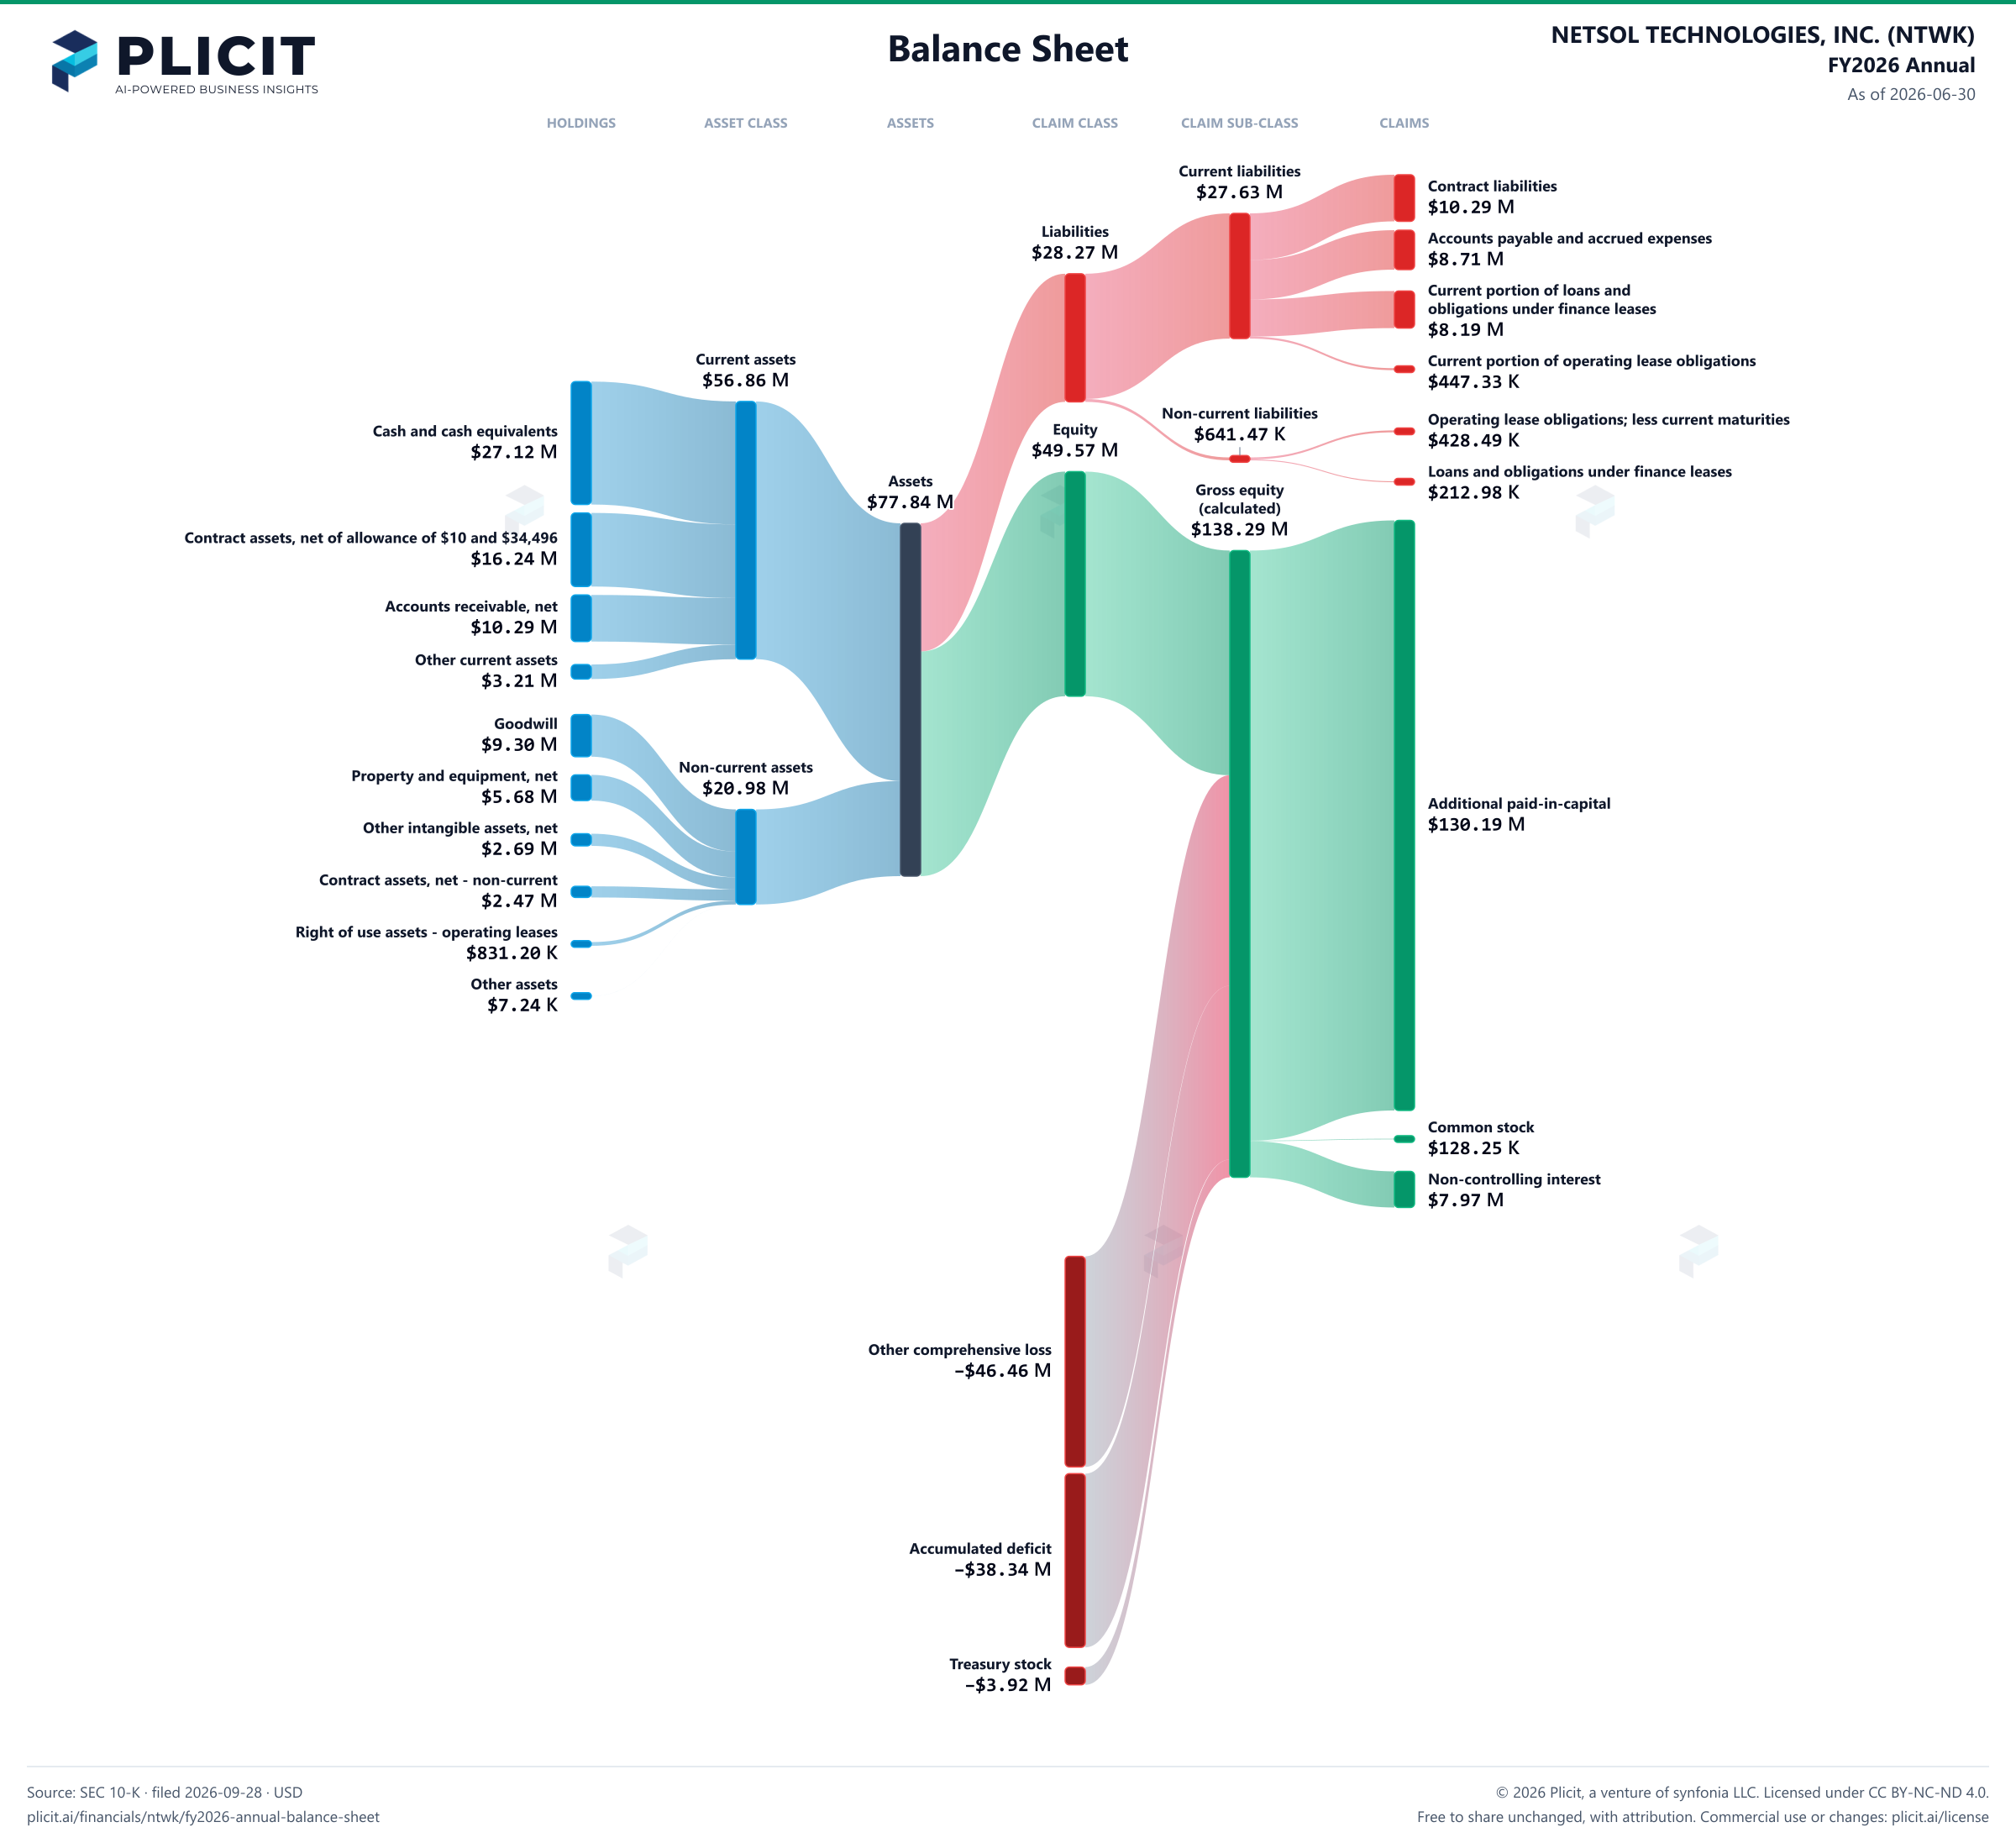
NETSOL TECHNOLOGIES, INC. (NTWK) FY2026 Annual Balance Sheet Sankey chart
Free to share unchanged, with credit to Plicit.ai · CC BY-NC-ND 4.0Download PNG

Newsletter

Get the teardowns by email

Subscribe if you want the public-company teardowns in your inbox when they're released.

Product waitlist

Health Check and Teardown for your own company

A health check uncovers insights of your private books, not a public ticker. Join this list to get notified as soon as we go-live!