
Nuvation Bio Inc. (NUVB) FY2026 Q2 Balance Sheet

Balance Sheet

As of 2026-06-30

Swipe to see the full flow
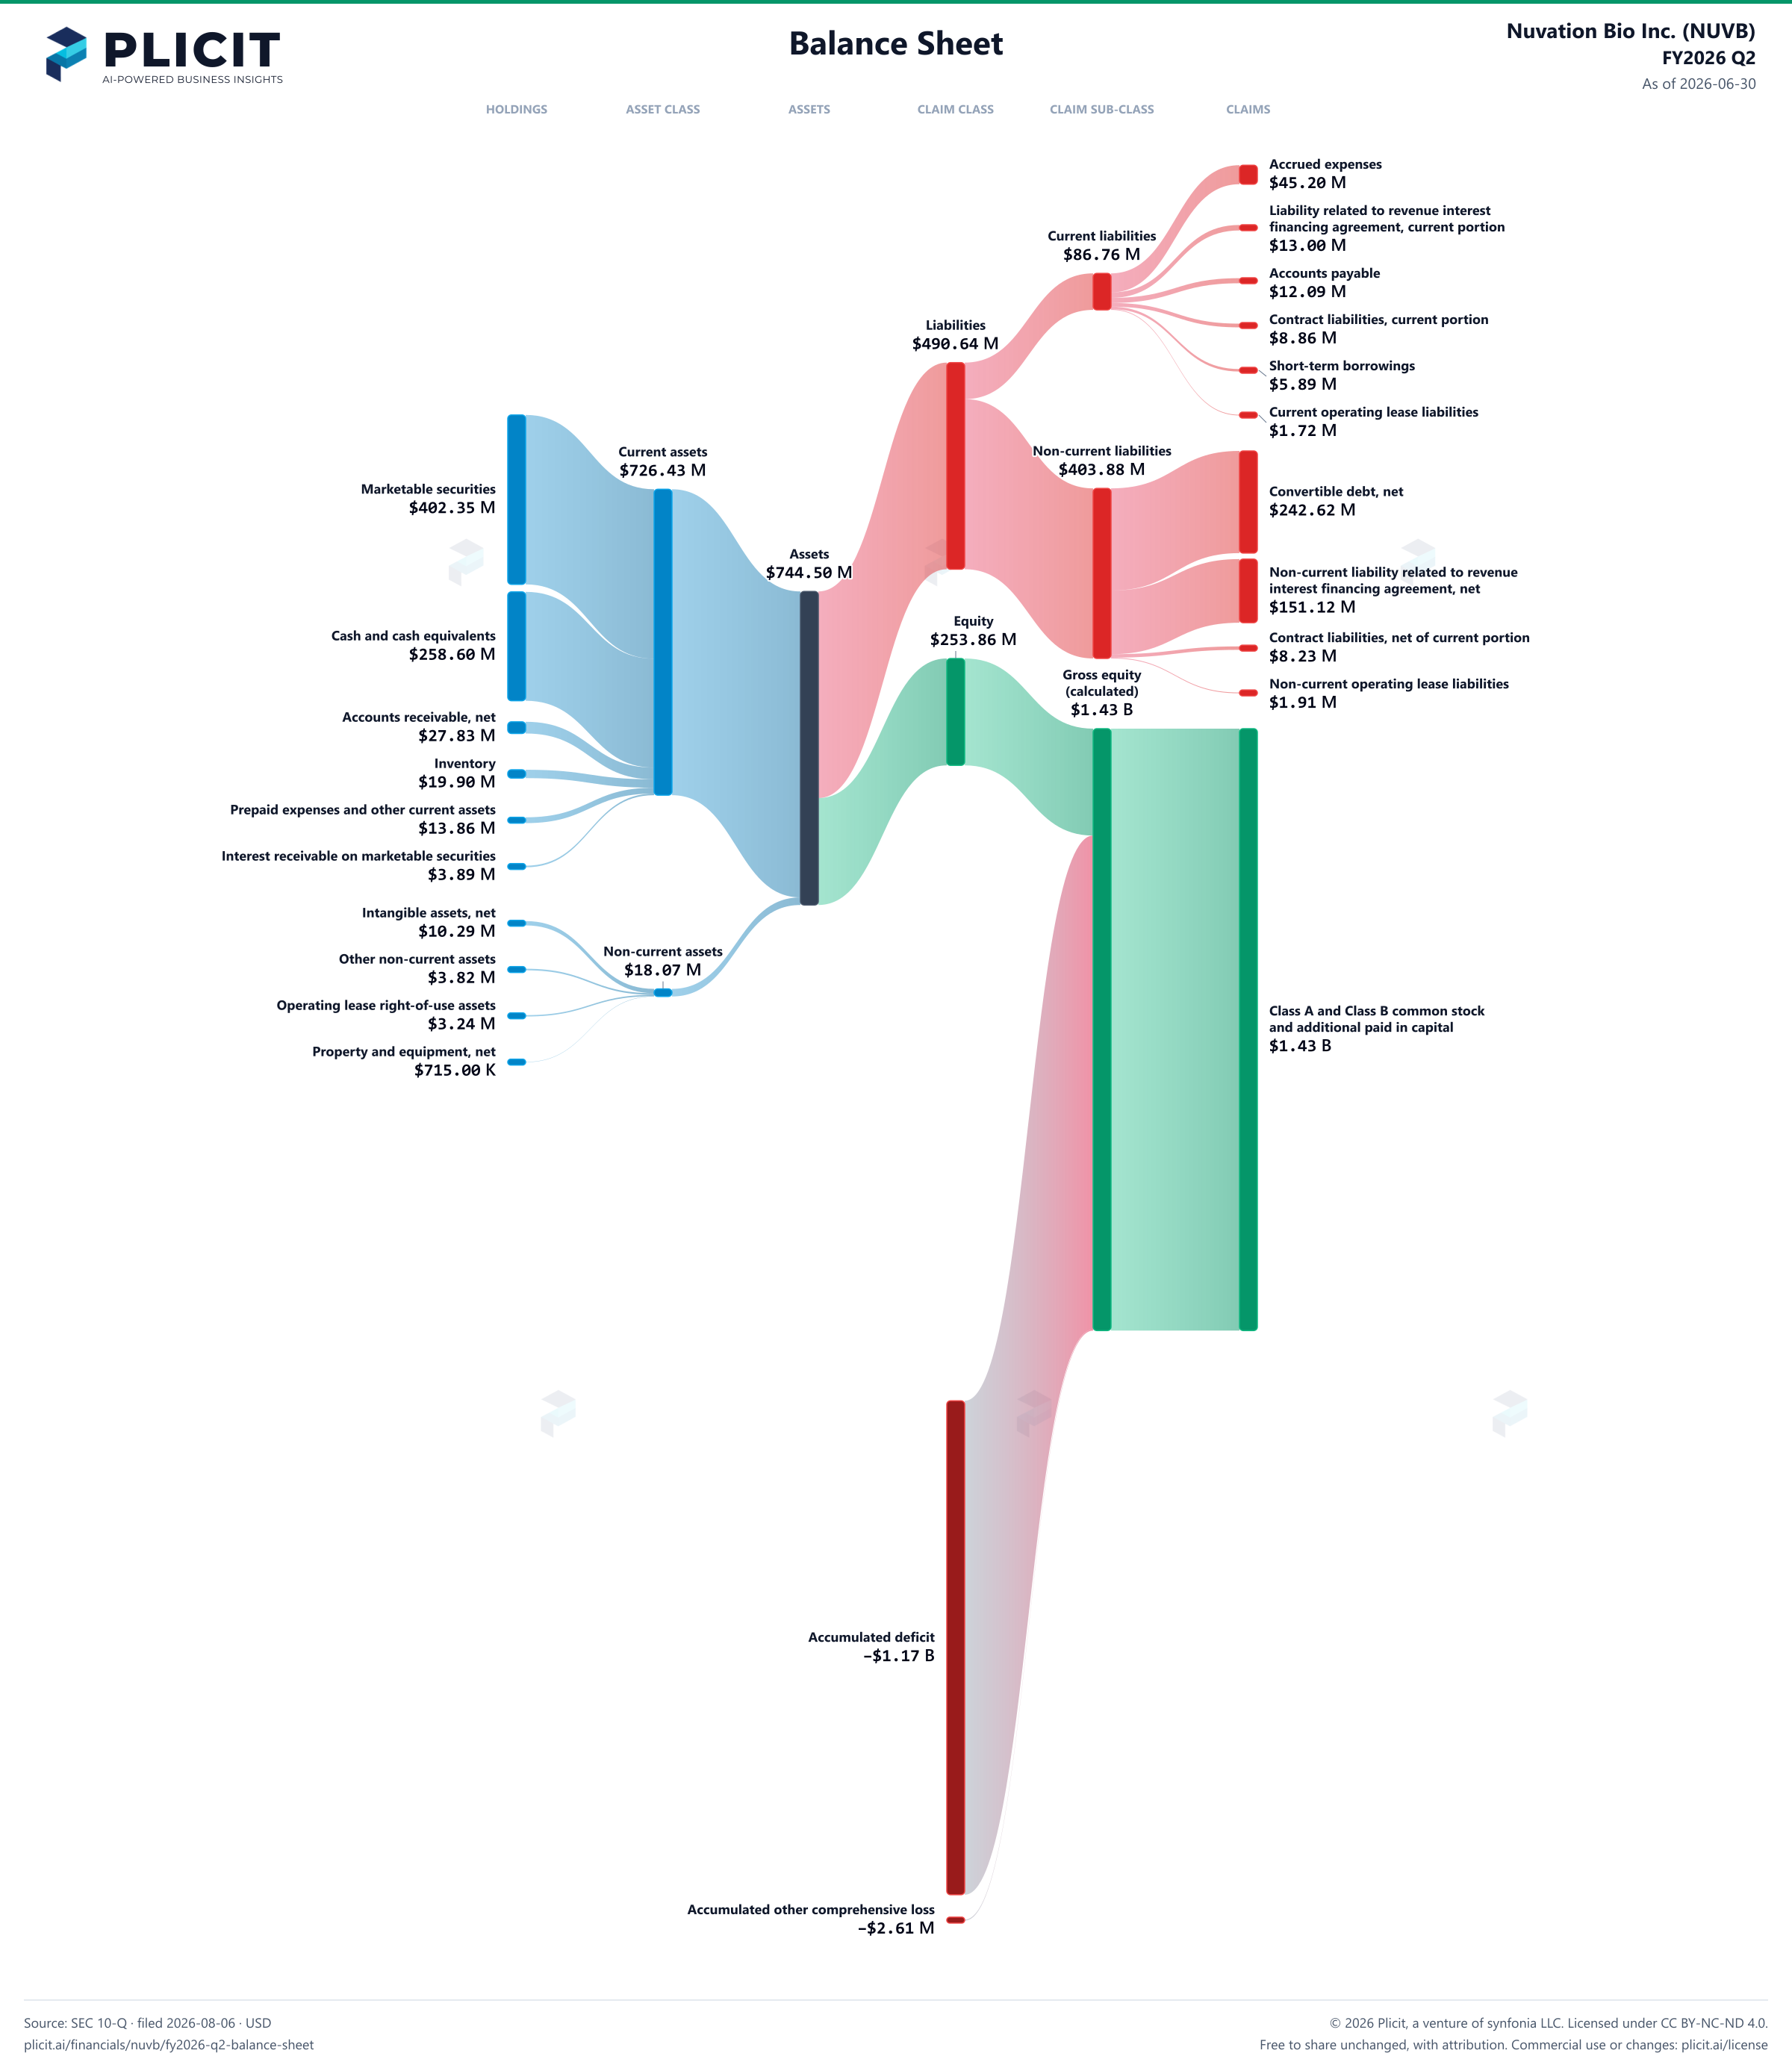
Nuvation Bio Inc. (NUVB) FY2026 Q2 Balance SheetBalance sheet as of 2026-06-30. The chart shows assets, liabilities and equity at that date.Current liabilities$86.76 MLiabilities$490.64 MNon-current liabilities$403.88 MCurrent assets$726.43 MAssets$744.50 MEquity$253.86 MGross equity(calculated)$1.43 BNon-current assets$18.07 MHOLDINGSASSET CLASSASSETSCLAIM CLASSCLAIM SUB-CLASSCLAIMSMarketable securitiesCash and cash equivalentsAccounts receivable, net of allowance for credit loss of $nil and $nilInventoryPrepaid expenses and other current assetsInterest receivable on marketable securitiesIntangible assets, net of accumulated amortization of $2,777 and $1,856, respectivelyOther non-current assetsOperating lease right-of-use assetsProperty and equipment, net of accumulated depreciation of $1,331 and $1,184, respectivelyAccrued expensesLiability related to revenue interest financing agreement, current portionAccounts payableContract liabilities, current portionShort-term borrowingsCurrent operating lease liabilitiesConvertible debt, net of deferred financing costs of $7,376Non-current liability related to revenue interest financing agreement, net of deferred financing costs of $3,818 and $4,241, respectivelyContract liabilities, net of current portionNon-current operating lease liabilitiesClass A and Class B common stock and additional paid in capital, $0.0001 par value per share; 1,060,000,000 (Class A 1,000,000,000, Class B 60,000,000 shares authorized as of June 30, 2026 and December 31, 2025 respectively 349,822,479 (Class A 348,822,479, Class B 1,000,000) and 346,503,675 (Class A 345,503,675, Class B 1,00,000) shares issued and outstanding as of June 30, 2026 and December 31, 2025, respectively.Current assetsNon-current assetsAssetsCurrent liabilitiesNon-current liabilitiesLiabilitiesEquityGross equity (calculated)Accumulated deficitAccumulated other comprehensive lossAccrued expensesAccrued expenses$45.20 MLiability related to revenue interest financing agreement, current portionLiability related to revenue interestfinancing agreement, current portion$13.00 MCurrent liabilitiesCurrent liabilities$86.76 MAccounts payableAccounts payable$12.09 MContract liabilities, current portionContract liabilities, current portion$8.86 MLiabilitiesLiabilities$490.64 MShort-term borrowingsShort-term borrowings$5.89 MCurrent operating lease liabilitiesCurrent operating lease liabilities$1.72 MNon-current liabilitiesNon-current liabilities$403.88 MCurrent assetsCurrent assets$726.43 MMarketable securitiesMarketable securities$402.35 MConvertible debt, net of deferred financing costs of $7,376Convertible debt, net$242.62 MAssetsAssets$744.50 MNon-current liability related to revenue interest financing agreement, net of deferred financing costs of $3,818 and $4,241, respectivelyNon-current liability related to revenueinterest financing agreement, net$151.12 MEquityEquity$253.86 MCash and cash equivalentsCash and cash equivalents$258.60 MContract liabilities, net of current portionContract liabilities, net of current portion$8.23 MGross equity (calculated)Gross equity(calculated)$1.43 BNon-current operating lease liabilitiesNon-current operating lease liabilities$1.91 MAccounts receivable, net of allowance for credit loss of $nil and $nilAccounts receivable, net$27.83 MInventoryInventory$19.90 MPrepaid expenses and other current assetsPrepaid expenses and other current assets$13.86 MInterest receivable on marketable securitiesInterest receivable on marketable securities$3.89 MIntangible assets, net of accumulated amortization of $2,777 and $1,856, respectivelyIntangible assets, net$10.29 MNon-current assetsNon-current assets$18.07 MOther non-current assetsOther non-current assets$3.82 MOperating lease right-of-use assetsOperating lease right-of-use assets$3.24 MClass A and Class B common stock and additional paid in capital, $0.0001 par value per share; 1,060,000,000 (Class A 1,000,000,000, Class B 60,000,000 shares authorized as of June 30, 2026 and December 31, 2025 respectively 349,822,479 (Class A 348,822,479, Class B 1,000,000) and 346,503,675 (Class A 345,503,675, Class B 1,00,000) shares issued and outstanding as of June 30, 2026 and December 31, 2025, respectively.Class A and Class B common stockand additional paid in capital$1.43 BProperty and equipment, net of accumulated depreciation of $1,331 and $1,184, respectivelyProperty and equipment, net$715.00 KAccumulated deficitAccumulated deficit−$1.17 BAccumulated other comprehensive lossAccumulated other comprehensive loss−$2.61 M
Chart details

Nuvation Bio Inc. (NUVB) FY2026 Q2 Balance Sheet

Balance sheet as of 2026-06-30. The chart shows assets, liabilities and equity at that date.

Assets
744,503,000 US dollars
Current assets
726,432,000 US dollars
Non-current assets
18,071,000 US dollars
Liabilities
490,639,000 US dollars
Current liabilities
86,755,000 US dollars
Non-current liabilities
403,884,000 US dollars
Equity
253,864,000 US dollars
Marketable securities
402,352,000 US dollars
Cash and cash equivalents
258,604,000 US dollars
Accounts receivable, net of allowance for credit loss of $nil and $nil
27,826,000 US dollars
Inventory
19,901,000 US dollars
Prepaid expenses and other current assets
13,861,000 US dollars
Interest receivable on marketable securities
3,888,000 US dollars
Intangible assets, net of accumulated amortization of $2,777 and $1,856, respectively
10,292,000 US dollars
Other non-current assets
3,824,000 US dollars
Operating lease right-of-use assets
3,240,000 US dollars
Property and equipment, net of accumulated depreciation of $1,331 and $1,184, respectively
715,000 US dollars
Accrued expenses
45,204,000 US dollars
Liability related to revenue interest financing agreement, current portion
12,999,000 US dollars
Accounts payable
12,089,000 US dollars
Contract liabilities, current portion
8,855,000 US dollars
Short-term borrowings
5,893,000 US dollars
Current operating lease liabilities
1,715,000 US dollars
Warrant liability
0 US dollars
Convertible debt, net of deferred financing costs of $7,376
242,624,000 US dollars
Non-current liability related to revenue interest financing agreement, net of deferred financing costs of $3,818 and $4,241, respectively
151,122,000 US dollars
Contract liabilities, net of current portion
8,228,000 US dollars
Non-current operating lease liabilities
1,910,000 US dollars
Long-term borrowings, net of deferred financing costs of $3,042
0 US dollars
Class A and Class B common stock and additional paid in capital, $0.0001 par value per share; 1,060,000,000 (Class A 1,000,000,000, Class B 60,000,000 shares authorized as of June 30, 2026 and December 31, 2025 respectively 349,822,479 (Class A 348,822,479, Class B 1,000,000) and 346,503,675 (Class A 345,503,675, Class B 1,00,000) shares issued and outstanding as of June 30, 2026 and December 31, 2025, respectively.
1,429,288,000 US dollars
Accumulated deficit
negative 1,172,813,000 US dollars
Accumulated other comprehensive loss
negative 2,611,000 US dollars
Gross equity (calculated)
1,429,288,000 US dollars. Net equity plus the magnitudes of its negative contributions equals gross positive equity. The negative contributions enter this reconciliation as add-backs; their filed signs stay negative.

Chart connections

  • Assets equal liabilities plus consolidated equity. Consolidated equity includes noncontrolling interests when reported.
  • Treasury shares and other negative equity contributions reduce equity.
Nuvation Bio Inc. (NUVB) FY2026 Q2 Balance Sheet Sankey chart
Free to share unchanged, with credit to Plicit.ai · CC BY-NC-ND 4.0Download PNG

Newsletter

Get the teardowns by email

Subscribe if you want the public-company teardowns in your inbox when they're released.

Product waitlist

Health Check and Teardown for your own company

A health check uncovers insights of your private books, not a public ticker. Join this list to get notified as soon as we go-live!