
Olin Corporation (OLN) FY2026 Q2 P&L / Income Statement

Revenue by Business Segment by Product and Service

2026-04-01 to 2026-06-30

Swipe to see the full flow
Olin Corporation (OLN) FY2026 Q2 P&L / Income StatementIncome statement for 2026-04-01 through 2026-06-30. View: Segments by Product and Service. Revenue uses this breakdown; costs and expenses retain the consolidated categories.SOURCESREVENUEGROSSOPERATINGPRE-TAXNETChlor Alkali Products and Vinyls - Chlorine, chlorine-derivatives and other co-productsChlor Alkali Products and Vinyls - Caustic sodaWinchester - Military and law enforcementEpoxy - Epoxy resinsWinchester - CommercialEpoxy - Aromatics and allylicsSalesGross profit (calculated)Cost of goods soldOperating income (loss)Operating costs, net of other operating income (calculated)Selling and administrativeAcquisition-related costsRestructuring chargesOther operating income (expense)Income (loss) before taxesOther income (expense), net (calculated)Net lossIncome tax provision (benefit)Gross profit (calculated)Gross profit(calculated)$170.20 MOperating income (loss)Operatingincome (loss)$46.50 MIncome (loss) before taxesIncome (loss)before taxes$3.80 MSalesSales$1.74 BNet lossNet loss−$13.30 MChlor Alkali Products and Vinyls - Chlorine, chlorine-derivatives and other co-productsChlor Alkali Products and Vinyls- Chlorine, chlorine-derivativesand other co-products$470.70 MOperating costs, net of other operating income (calculated)Operating costs,net (calculated)$123.70 MIncome tax provision (benefit)Income taxprovision (benefit)$17.10 MCost of goods soldCost of goods sold$1.57 BSelling and administrativeSelling and administrative$102.70 MOther income (expense), net (calculated)Other income,net (calculated)−$42.70 MChlor Alkali Products and Vinyls - Caustic sodaChlor Alkali Products andVinyls - Caustic soda$348.80 MAcquisition-related costsAcquisition-related costs$10.60 MWinchester - Military and law enforcementWinchester - Militaryand law enforcement$307.90 MRestructuring chargesRestructuring charges$10.50 MOther operating income (expense)Other operating income (expense)−$100.00 KEpoxy - Epoxy resinsEpoxy - Epoxy resins$249.80 MWinchester - CommercialWinchester - Commercial$192.40 MEpoxy - Aromatics and allylicsEpoxy - Aromatics and allylics$172.30 M
Chart details

Olin Corporation (OLN) FY2026 Q2 P&L / Income Statement

Income statement for 2026-04-01 through 2026-06-30. View: Segments by Product and Service. Revenue uses this breakdown; costs and expenses retain the consolidated categories.

Sales
1,741,900,000 US dollars
Cost of goods sold
1,571,700,000 US dollars
Gross profit (calculated)
170,200,000 US dollars
Operating costs, net of other operating income (calculated)
123,700,000 US dollars
Operating income (loss)
46,500,000 US dollars
Other income (expense), net (calculated)
negative 42,700,000 US dollars
Income (loss) before taxes
3,800,000 US dollars
Income tax provision (benefit)
17,100,000 US dollars
Net loss
negative 13,300,000 US dollars
Chlor Alkali Products and Vinyls - Caustic soda
348,800,000 US dollars
Chlor Alkali Products and Vinyls - Chlorine, chlorine-derivatives and other co-products
470,700,000 US dollars
Epoxy - Aromatics and allylics
172,300,000 US dollars
Epoxy - Epoxy resins
249,800,000 US dollars
Winchester - Commercial
192,400,000 US dollars
Winchester - Military and law enforcement
307,900,000 US dollars
Selling and administrative
102,700,000 US dollars
Restructuring charges
10,500,000 US dollars
Acquisition-related costs
10,600,000 US dollars
Other operating income (expense)
negative 100,000 US dollars

Chart connections

  • Revenue less cost of revenue equals gross profit; gross profit less operating expenses equals operating income.
  • Operating income plus other income or expense equals income before tax. Income before tax less income tax expense or benefit equals net income.
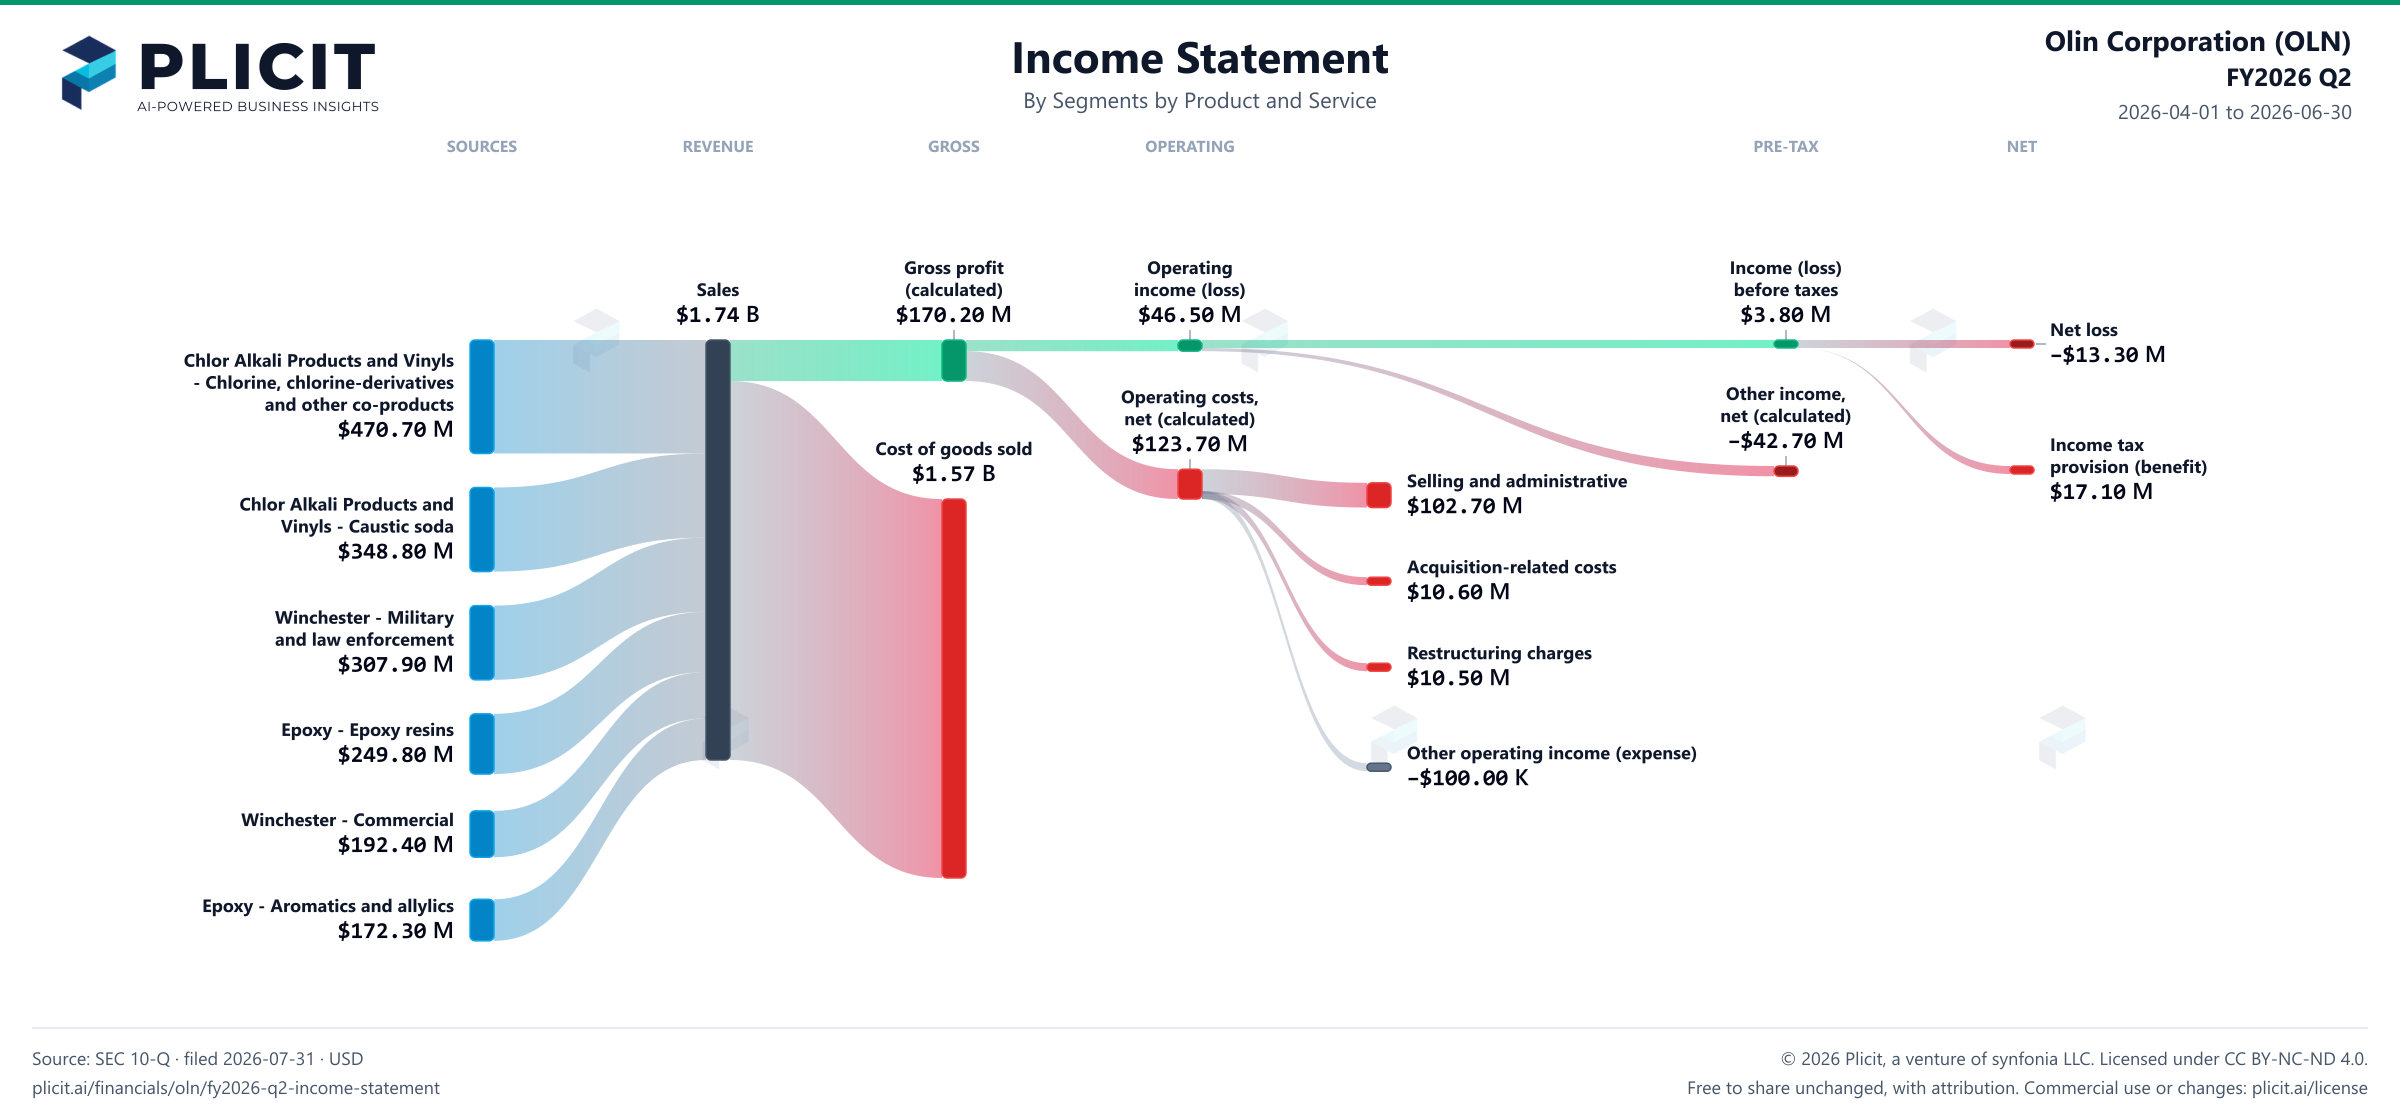
Olin Corporation (OLN) FY2026 Q2 Revenue by Business Segment by Product and Service Sankey chart
Free to share unchanged, with credit to Plicit.ai · CC BY-NC-ND 4.0Download PNG

Gross margin

9.8%

Gross profit / revenue

Operating margin

2.7%

Operating profit / revenue

Newsletter

Get the teardowns by email

Subscribe if you want the public-company teardowns in your inbox when they're released.

Product waitlist

Health Check and Teardown for your own company

A health check uncovers insights of your private books, not a public ticker. Join this list to get notified as soon as we go-live!