
ONTO INNOVATION INC. (ONTO) FY2025 Q3 Balance Sheet

Balance Sheet

As of 2025-09-27

Swipe to see the full flow
ONTO INNOVATION INC. (ONTO) FY2025 Q3 Balance SheetBalance sheet as of 2025-09-27. The chart shows assets, liabilities and equity at that date.Current liabilities$162.87 MCurrent assets$1.54 BLiabilities$184.54 MAssets$2.19 BNon-current liabilities$21.67 MEquity$2.00 BGross equity(calculated)$2.01 BNon-current assets$641.67 MHOLDINGSASSET CLASSASSETSCLAIM CLASSCLAIM SUB-CLASSCLAIMSCash and cash equivalentsMarketable securitiesAccounts receivable, less allowance of $2,613 and $2,659Inventories, netPrepaid expenses and other current assetsGoodwillProperty, plant and equipment, netIdentifiable intangible assets, netDeferred income taxesOther assetsAccounts payableAccrued liabilitiesDeferred revenueOther current liabilitiesOther non-current liabilitiesDeferred income taxesAdditional paid-in capitalRetained earningsCommon stockCurrent assetsNon-current assetsAssetsCurrent liabilitiesNon-current liabilitiesLiabilitiesEquityGross equity (calculated)Accumulated other comprehensive lossAccounts payableAccounts payable$52.93 MCurrent liabilitiesCurrent liabilities$162.87 MCurrent assetsCurrent assets$1.54 BAccrued liabilitiesAccrued liabilities$48.91 MCash and cash equivalentsCash and cash equivalents$603.09 MDeferred revenueDeferred revenue$30.76 MLiabilitiesLiabilities$184.54 MAssetsAssets$2.19 BOther current liabilitiesOther current liabilities$30.27 MMarketable securitiesMarketable securities$380.84 MNon-current liabilitiesNon-current liabilities$21.67 MEquityEquity$2.00 BOther non-current liabilitiesOther non-current liabilities$21.67 MAccounts receivable, less allowance of $2,613 and $2,659Accounts receivable, net$260.20 MDeferred income taxesDeferred income taxes$4.00 KGross equity (calculated)Gross equity(calculated)$2.01 BInventories, netInventories, net$259.37 MPrepaid expenses and other current assetsPrepaid expenses and other current assets$41.44 MGoodwillGoodwill$330.04 MAdditional paid-in capitalAdditional paid-in capital$1.28 BNon-current assetsNon-current assets$641.67 MProperty, plant and equipment, netProperty, plant and equipment, net$129.07 MIdentifiable intangible assets, netIdentifiable intangible assets, net$102.12 MDeferred income taxesDeferred income taxes$57.20 MRetained earningsRetained earnings$733.26 MOther assetsOther assets$23.24 MCommon stockCommon stock$49.00 KAccumulated other comprehensive lossAccumulated other comprehensive loss−$6.42 M
Chart details

ONTO INNOVATION INC. (ONTO) FY2025 Q3 Balance Sheet

Balance sheet as of 2025-09-27. The chart shows assets, liabilities and equity at that date.

Assets
2,186,610,000 US dollars
Current assets
1,544,936,000 US dollars
Non-current assets
641,674,000 US dollars
Liabilities
184,544,000 US dollars
Current liabilities
162,870,000 US dollars
Non-current liabilities
21,674,000 US dollars
Equity
2,002,066,000 US dollars
Cash and cash equivalents
603,085,000 US dollars
Marketable securities
380,843,000 US dollars
Accounts receivable, less allowance of $2,613 and $2,659
260,197,000 US dollars
Inventories, net
259,370,000 US dollars
Prepaid expenses and other current assets
41,441,000 US dollars
Goodwill
330,037,000 US dollars
Property, plant and equipment, net
129,071,000 US dollars
Identifiable intangible assets, net
102,121,000 US dollars
Deferred income taxes
57,203,000 US dollars
Other assets
23,242,000 US dollars
Accounts payable
52,925,000 US dollars
Accrued liabilities
48,913,000 US dollars
Deferred revenue
30,764,000 US dollars
Other current liabilities
30,268,000 US dollars
Other non-current liabilities
21,670,000 US dollars
Deferred income taxes
4,000 US dollars
Additional paid-in capital
1,275,184,000 US dollars
Retained earnings
733,256,000 US dollars
Common stock
49,000 US dollars
Accumulated other comprehensive loss
negative 6,423,000 US dollars
Gross equity (calculated)
2,008,489,000 US dollars. Net equity plus the magnitudes of its negative contributions equals gross positive equity. The negative contributions enter this reconciliation as add-backs; their filed signs stay negative.

Chart connections

  • Assets equal liabilities plus consolidated equity. Consolidated equity includes noncontrolling interests when reported.
  • Treasury shares and other negative equity contributions reduce equity.
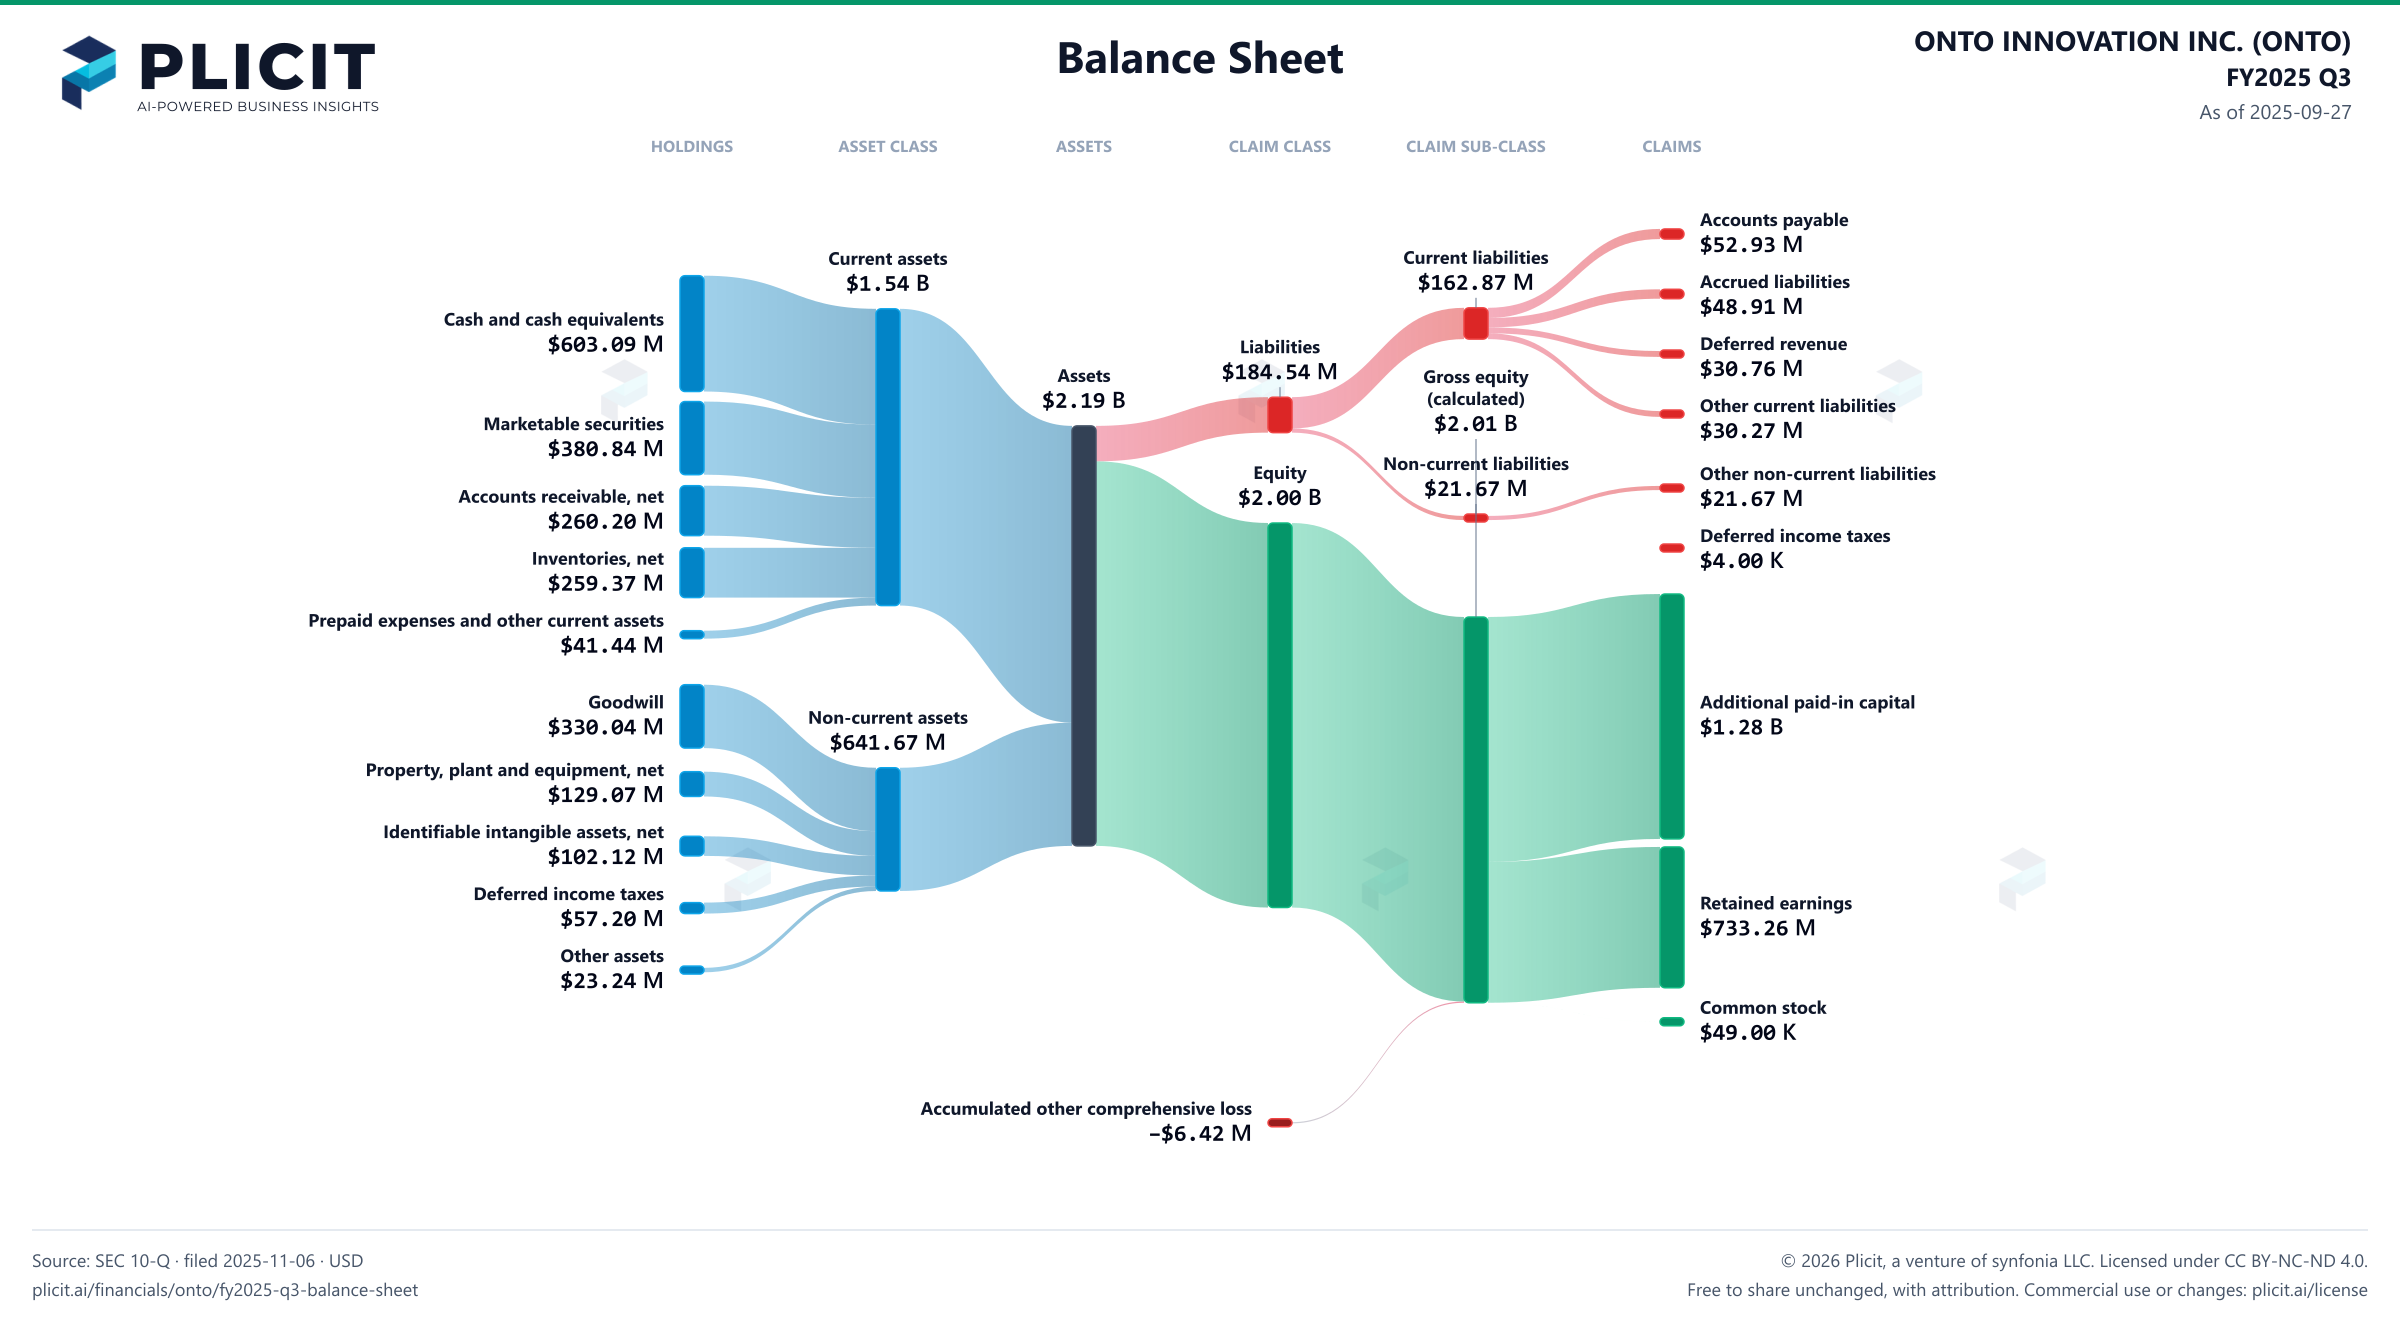
ONTO INNOVATION INC. (ONTO) FY2025 Q3 Balance Sheet Sankey chart
Free to share unchanged, with credit to Plicit.ai · CC BY-NC-ND 4.0Download PNG

Newsletter

Get the teardowns by email

Subscribe if you want the public-company teardowns in your inbox when they're released.

Product waitlist

Health Check and Teardown for your own company

A health check uncovers insights of your private books, not a public ticker. Join this list to get notified as soon as we go-live!