
Oracle Corporation (ORCL) FY2027 Q1 Balance Sheet

Balance Sheet

As of 2026-08-31

Swipe to see the full flow
Oracle Corporation (ORCL) FY2027 Q1 Balance SheetBalance sheet as of 2026-08-31. The chart shows assets, liabilities and equity at that date.Current liabilities$47.51 BCurrent assets$55.63 BLiabilities(calculated)$236.06 BAssets$303.26 BNon-current liabilities$188.55 BNon-current assets$247.63 BEquity$67.20 BGross equity(calculated)$69.70 BHOLDINGSASSET CLASSASSETSCLAIM CLASSCLAIM SUB-CLASSCLAIMSCash and cash equivalentsTrade receivables, net of allowances for credit losses of $536 and $542 as of August 31, 2026 and May 31, 2026, respectivelyPrepaid expenses and other current assetsMarketable securitiesProperty, plant and equipment, netGoodwillOperating lease right-of-use assetsOther non-current assetsDeferred tax assetsDeferred revenuesOther current liabilitiesAccounts payableNotes payable and other borrowings, currentAccrued compensation and related benefitsNotes payable and other borrowings, non-currentOperating lease liabilitiesOther non-current liabilitiesIncome taxes payableCommon stock, $0.01 par value and additional paid in capital - authorized: 11,000 shares; outstanding: 3,024 shares and 2,880 shares as of August 31, 2026 and May 31, 2026, respectivelyPreferred stock, $0.01 par value and additional paid in capital - authorized: 1.0 shares; outstanding: 0.05 shares as of each of August 31, 2026 and May 31, 2026, of 6.50% Series D Mandatory Convertible Preferred StockNoncontrolling interestsCurrent assetsNon-current assetsAssetsCurrent liabilitiesNon-current liabilitiesLiabilities (calculated)EquityGross equity (calculated)Accumulated other comprehensive lossAccumulated deficitDeferred revenuesDeferred revenues$14.69 BCurrent liabilitiesCurrent liabilities$47.51 BOther current liabilitiesOther current liabilities$12.38 BCash and cash equivalentsCash and cash equivalents$36.37 BCurrent assetsCurrent assets$55.63 BLiabilities (calculated)Liabilities(calculated)$236.06 BAccounts payableAccounts payable$11.06 BTrade receivables, net of allowances for credit losses of $536 and $542 as of August 31, 2026 and May 31, 2026, respectivelyTrade receivables, net$11.39 BAssetsAssets$303.26 BNotes payable and other borrowings, currentNotes payable and other borrowings, current$7.63 BPrepaid expenses and other current assetsPrepaid expenses and other current assets$7.16 BAccrued compensation and related benefitsAccrued compensation and related benefits$1.76 BMarketable securitiesMarketable securities$708.00 MNon-current liabilitiesNon-current liabilities$188.55 BNon-current assetsNon-current assets$247.63 BNotes payable and other borrowings, non-currentNotes payable and other borrowings, non-current$117.71 BProperty, plant and equipment, netProperty, plant and equipment, net$127.85 BOperating lease liabilitiesOperating lease liabilities$30.59 BOther non-current liabilitiesOther non-current liabilities$28.18 BGoodwillGoodwill$62.27 BEquityEquity$67.20 BIncome taxes payableIncome taxes payable$12.06 BOperating lease right-of-use assetsOperating lease right-of-use assets$33.97 BGross equity (calculated)Gross equity(calculated)$69.70 BCommon stock, $0.01 par value and additional paid in capital - authorized: 11,000 shares; outstanding: 3,024 shares and 2,880 shares as of August 31, 2026 and May 31, 2026, respectivelyCommon stock$64.32 BOther non-current assetsOther non-current assets$11.93 BDeferred tax assetsDeferred tax assets$11.63 BPreferred stock, $0.01 par value and additional paid in capital - authorized: 1.0 shares; outstanding: 0.05 shares as of each of August 31, 2026 and May 31, 2026, of 6.50% Series D Mandatory Convertible Preferred StockPreferred stock$4.95 BNoncontrolling interestsNoncontrolling interests$424.00 MAccumulated other comprehensive lossAccumulated other comprehensive loss−$1.39 BAccumulated deficitAccumulated deficit−$1.11 B
Chart details

Oracle Corporation (ORCL) FY2027 Q1 Balance Sheet

Balance sheet as of 2026-08-31. The chart shows assets, liabilities and equity at that date.

Assets
303,259,000,000 US dollars
Current assets
55,630,000,000 US dollars
Non-current assets
247,629,000,000 US dollars
Liabilities (calculated)
236,063,000,000 US dollars
Current liabilities
47,514,000,000 US dollars
Non-current liabilities
188,549,000,000 US dollars
Equity
67,196,000,000 US dollars
Noncontrolling interest
424,000,000 US dollars. Included in consolidated equity; this amount is not added again.
Cash and cash equivalents
36,369,000,000 US dollars
Trade receivables, net of allowances for credit losses of $536 and $542 as of August 31, 2026 and May 31, 2026, respectively
11,394,000,000 US dollars
Prepaid expenses and other current assets
7,159,000,000 US dollars
Marketable securities
708,000,000 US dollars
Property, plant and equipment, net
127,845,000,000 US dollars
Goodwill
62,267,000,000 US dollars
Operating lease right-of-use assets
33,967,000,000 US dollars
Other non-current assets
11,925,000,000 US dollars
Deferred tax assets
11,625,000,000 US dollars
Deferred revenues
14,686,000,000 US dollars
Other current liabilities
12,380,000,000 US dollars
Accounts payable
11,063,000,000 US dollars
Notes payable and other borrowings, current
7,625,000,000 US dollars
Accrued compensation and related benefits
1,760,000,000 US dollars
Notes payable and other borrowings, non-current
117,712,000,000 US dollars
Operating lease liabilities
30,594,000,000 US dollars
Other non-current liabilities
28,183,000,000 US dollars
Income taxes payable
12,060,000,000 US dollars
Common stock, $0.01 par value and additional paid in capital - authorized: 11,000 shares; outstanding: 3,024 shares and 2,880 shares as of August 31, 2026 and May 31, 2026, respectively
64,319,000,000 US dollars
Preferred stock, $0.01 par value and additional paid in capital - authorized: 1.0 shares; outstanding: 0.05 shares as of each of August 31, 2026 and May 31, 2026, of 6.50% Series D Mandatory Convertible Preferred Stock
4,954,000,000 US dollars
Noncontrolling interests
424,000,000 US dollars
Accumulated other comprehensive loss
negative 1,387,000,000 US dollars
Accumulated deficit
negative 1,114,000,000 US dollars
Gross equity (calculated)
69,697,000,000 US dollars. Net equity plus the magnitudes of its negative contributions equals gross positive equity. The negative contributions enter this reconciliation as add-backs; their filed signs stay negative.

Chart connections

  • Assets equal liabilities plus consolidated equity. Consolidated equity includes noncontrolling interests when reported.
  • Treasury shares and other negative equity contributions reduce equity.
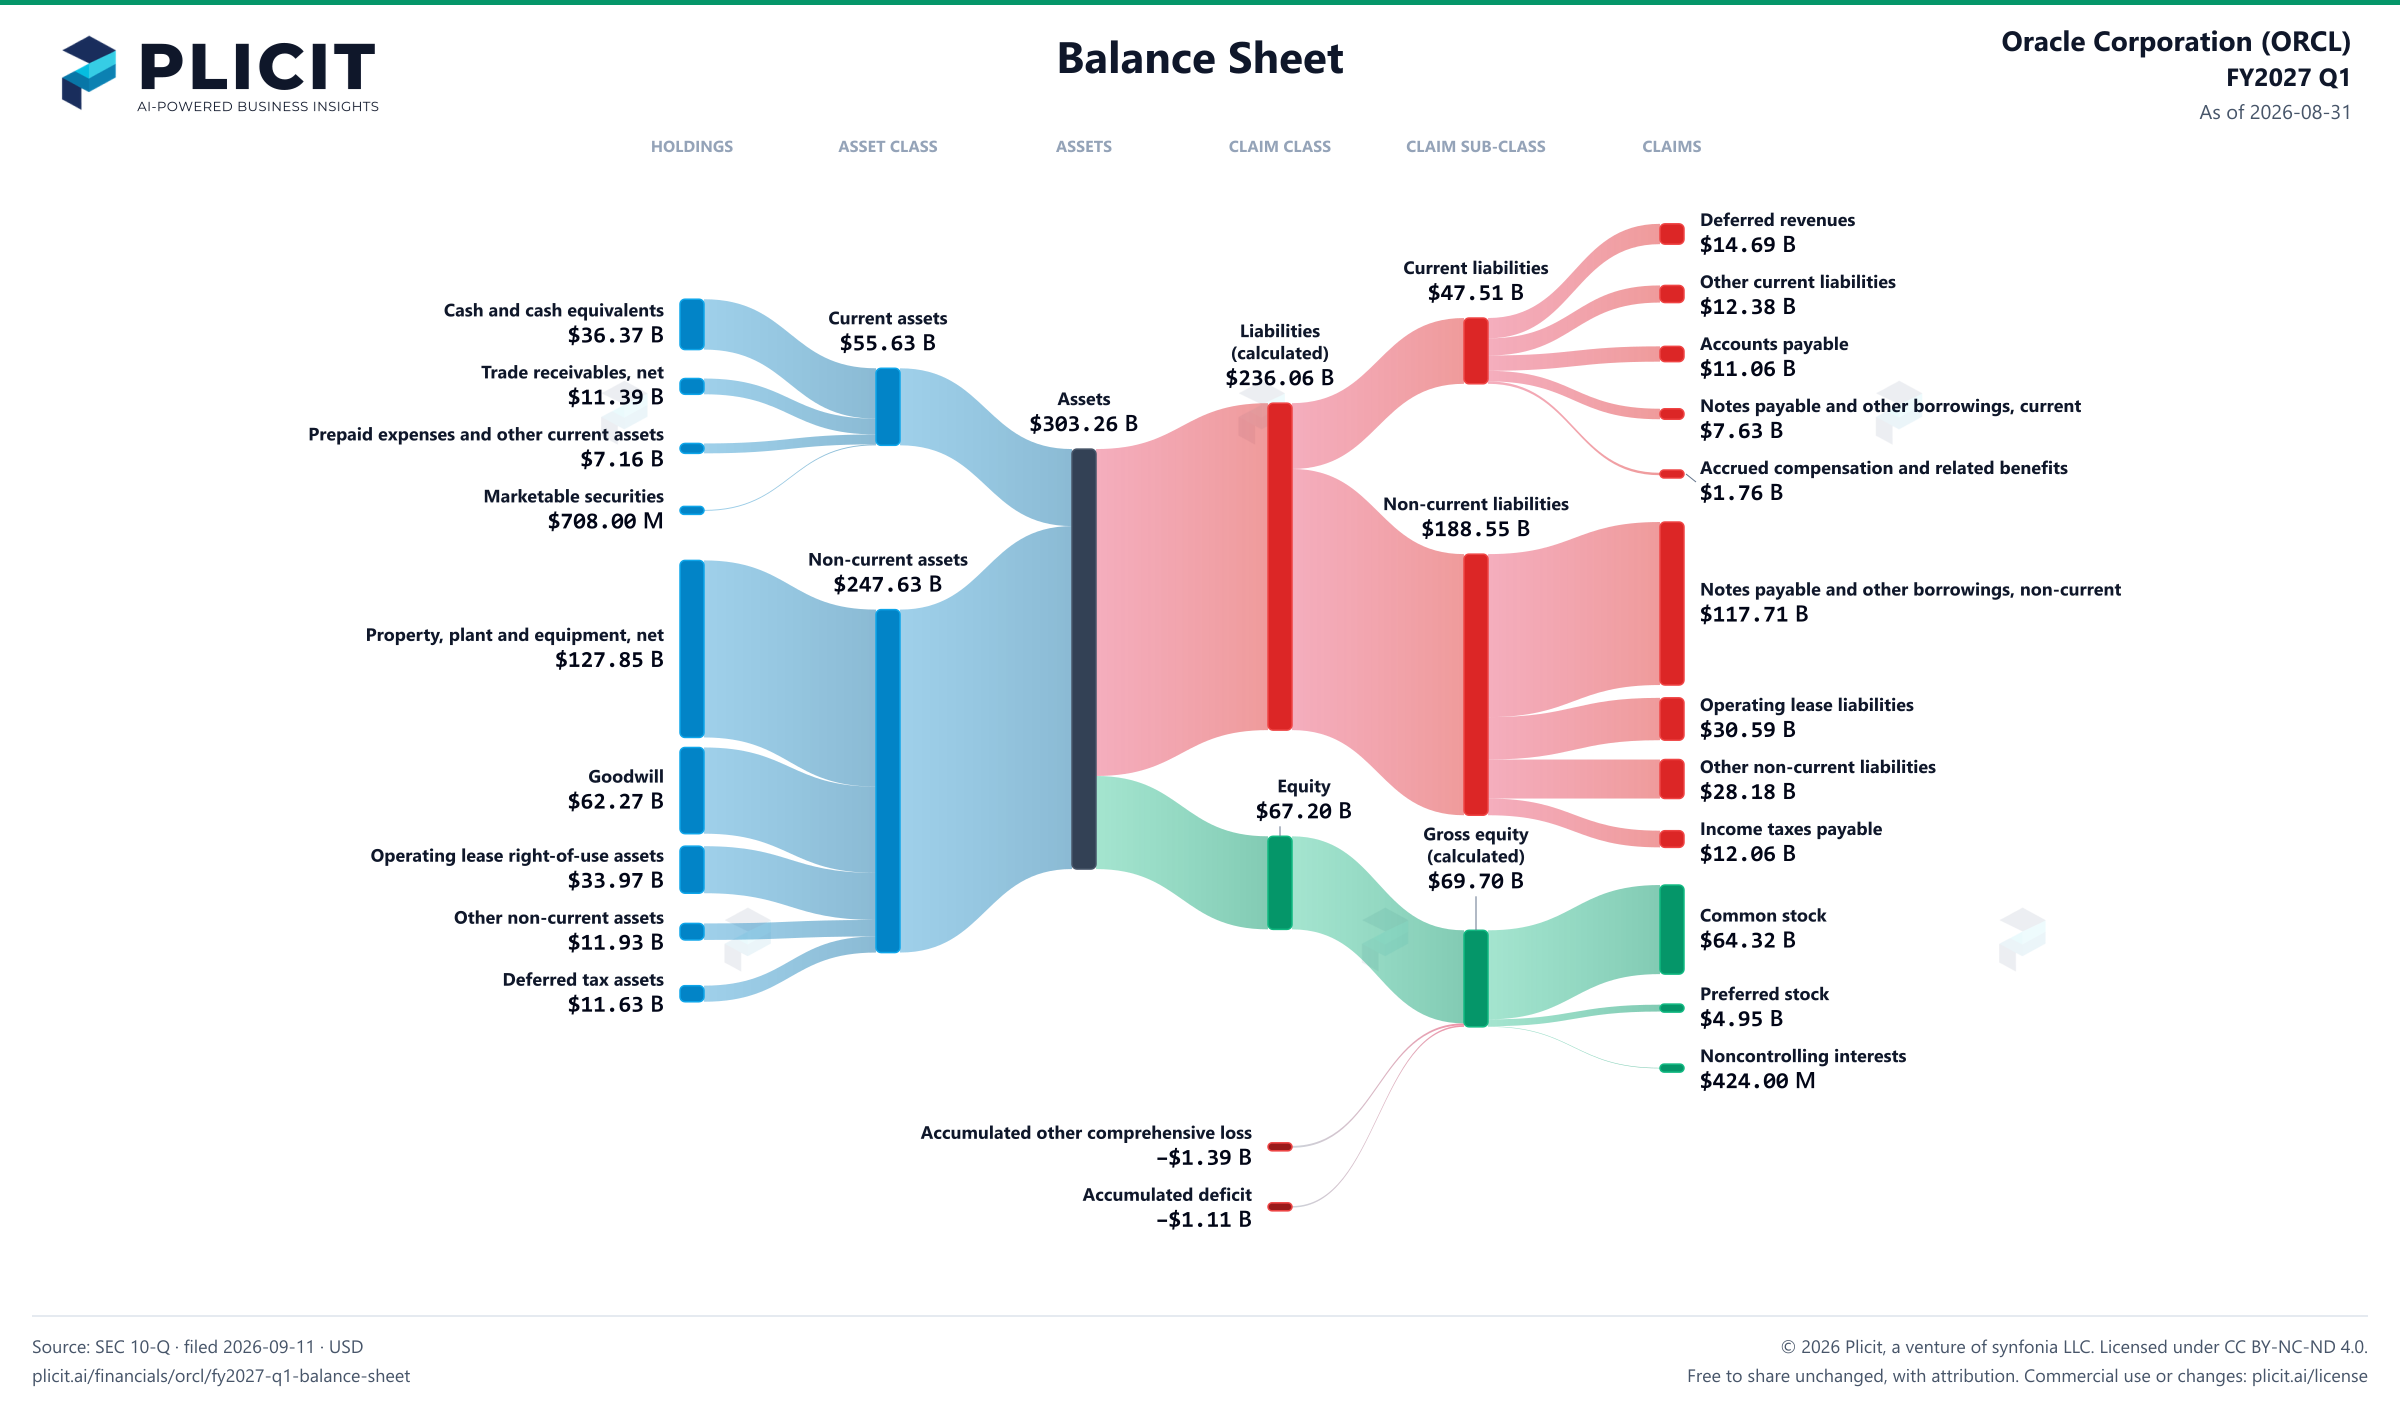
Oracle Corporation (ORCL) FY2027 Q1 Balance Sheet Sankey chart
Free to share unchanged, with credit to Plicit.ai · CC BY-NC-ND 4.0Download PNG

Newsletter

Get the teardowns by email

Subscribe if you want the public-company teardowns in your inbox when they're released.

Product waitlist

Health Check and Teardown for your own company

A health check uncovers insights of your private books, not a public ticker. Join this list to get notified as soon as we go-live!