
BLUE OWL CAPITAL INC. (OWL) FY2026 Q2 Balance Sheet

Balance Sheet

As of 2026-06-30

Swipe to see the full flow
BLUE OWL CAPITAL INC. (OWL) FY2026 Q2 Balance SheetBalance sheet as of 2026-06-30. The chart shows assets, liabilities and equity at that date.Liabilities$6.72 BAssets$12.33 BEquity$5.61 BHOLDINGSASSETSCLAIM CLASSCLAIM SUB-CLASSCLAIMSGoodwillIntangible assets, netDeferred tax assetsDue from related partiesInvestments (includes $423,339 and $358,153 at fair value and $222,081 and $162,747 of investments in the Company’s products, respectively)Operating lease assetsOther assets, netStrategic Revenue-Share Purchase consideration, netCash and cash equivalentsDebt obligations, netTRA liability (includes $98,659 and $106,793 at fair value, respectively)Operating lease liabilitiesAccrued compensationAccounts payable, accrued expenses and other liabilitiesEarnout liability, at fair valueDeferred tax liabilitiesAdditional paid-in capitalStockholders’ equity attributable to noncontrolling interestsAccumulated other comprehensive incomeCommon stock value - Class A SharesCommon stock value - Class C SharesCommon stock value - Class D SharesAccumulated deficitAssetsLiabilitiesEquityEquityDebt obligations, netDebt obligations, net$3.81 BLiabilitiesLiabilities$6.72 BTRA liability (includes $98,659 and $106,793 at fair value, respectively)TRA liability$1.64 BOperating lease liabilitiesOperating lease liabilities$532.32 MGoodwillGoodwill$5.62 BAccrued compensationAccrued compensation$434.73 MAccounts payable, accrued expenses and other liabilitiesAccounts payable, accruedexpenses and other liabilities$172.62 MAssetsAssets$12.33 BIntangible assets, netIntangible assets, net$2.72 BEarnout liability, at fair valueEarnout liability, at fair value$93.70 MDeferred tax assetsDeferred tax assets$1.43 BDeferred tax liabilitiesDeferred tax liabilities$38.00 MDue from related partiesDue from related parties$690.84 MAdditional paid-in capitalAdditional paid-in capital$3.88 BInvestments (includes $423,339 and $358,153 at fair value and $222,081 and $162,747 of investments in the Company’s products, respectively)Investments$563.67 MEquityEquity$5.61 BOperating lease assetsOperating lease assets$450.64 MStockholders’ equity attributable to noncontrolling interestsStockholders’ equity attributableto noncontrolling interests$3.62 BOther assets, netOther assets, net$382.90 MAccumulated other comprehensive incomeAccumulated other comprehensive income$2.47 MStrategic Revenue-Share Purchase consideration, netStrategic Revenue-Share Purchase consideration, net$307.12 MCommon stock value - Class A SharesCommon stock value - Class A Shares$68.00 KCash and cash equivalentsCash and cash equivalents$169.06 MCommon stock value - Class C SharesCommon stock value - Class C Shares$57.00 KCommon stock value - Class D SharesCommon stock value - Class D Shares$30.00 KAccumulated deficitAccumulated deficit−$1.89 B
Chart details

BLUE OWL CAPITAL INC. (OWL) FY2026 Q2 Balance Sheet

Balance sheet as of 2026-06-30. The chart shows assets, liabilities and equity at that date.

Assets
12,334,159,000 US dollars
Liabilities
6,720,362,000 US dollars
Equity
5,613,797,000 US dollars
Noncontrolling interest
3,617,267,000 US dollars. Included in consolidated equity; this amount is not added again.
Goodwill
5,624,469,000 US dollars
Intangible assets, net
2,718,784,000 US dollars
Deferred tax assets
1,426,676,000 US dollars
Due from related parties
690,838,000 US dollars
Investments (includes $423,339 and $358,153 at fair value and $222,081 and $162,747 of investments in the Company’s products, respectively)
563,671,000 US dollars
Operating lease assets
450,642,000 US dollars
Other assets, net
382,902,000 US dollars
Strategic Revenue-Share Purchase consideration, net
307,120,000 US dollars
Cash and cash equivalents
169,057,000 US dollars
Debt obligations, net
3,812,233,000 US dollars
TRA liability (includes $98,659 and $106,793 at fair value, respectively)
1,636,766,000 US dollars
Operating lease liabilities
532,315,000 US dollars
Accrued compensation
434,731,000 US dollars
Accounts payable, accrued expenses and other liabilities
172,622,000 US dollars
Earnout liability, at fair value
93,700,000 US dollars
Deferred tax liabilities
37,995,000 US dollars
Additional paid-in capital
3,882,396,000 US dollars
Accumulated other comprehensive income
2,473,000 US dollars
Common stock value - Class A Shares
68,000 US dollars
Common stock value - Class C Shares
57,000 US dollars
Common stock value - Class D Shares
30,000 US dollars
Stockholders’ equity attributable to noncontrolling interests
3,617,267,000 US dollars
Accumulated deficit
negative 1,888,494,000 US dollars

Chart connections

  • Assets equal liabilities plus consolidated equity. Consolidated equity includes noncontrolling interests when reported.
  • Treasury shares and other negative equity contributions reduce equity.
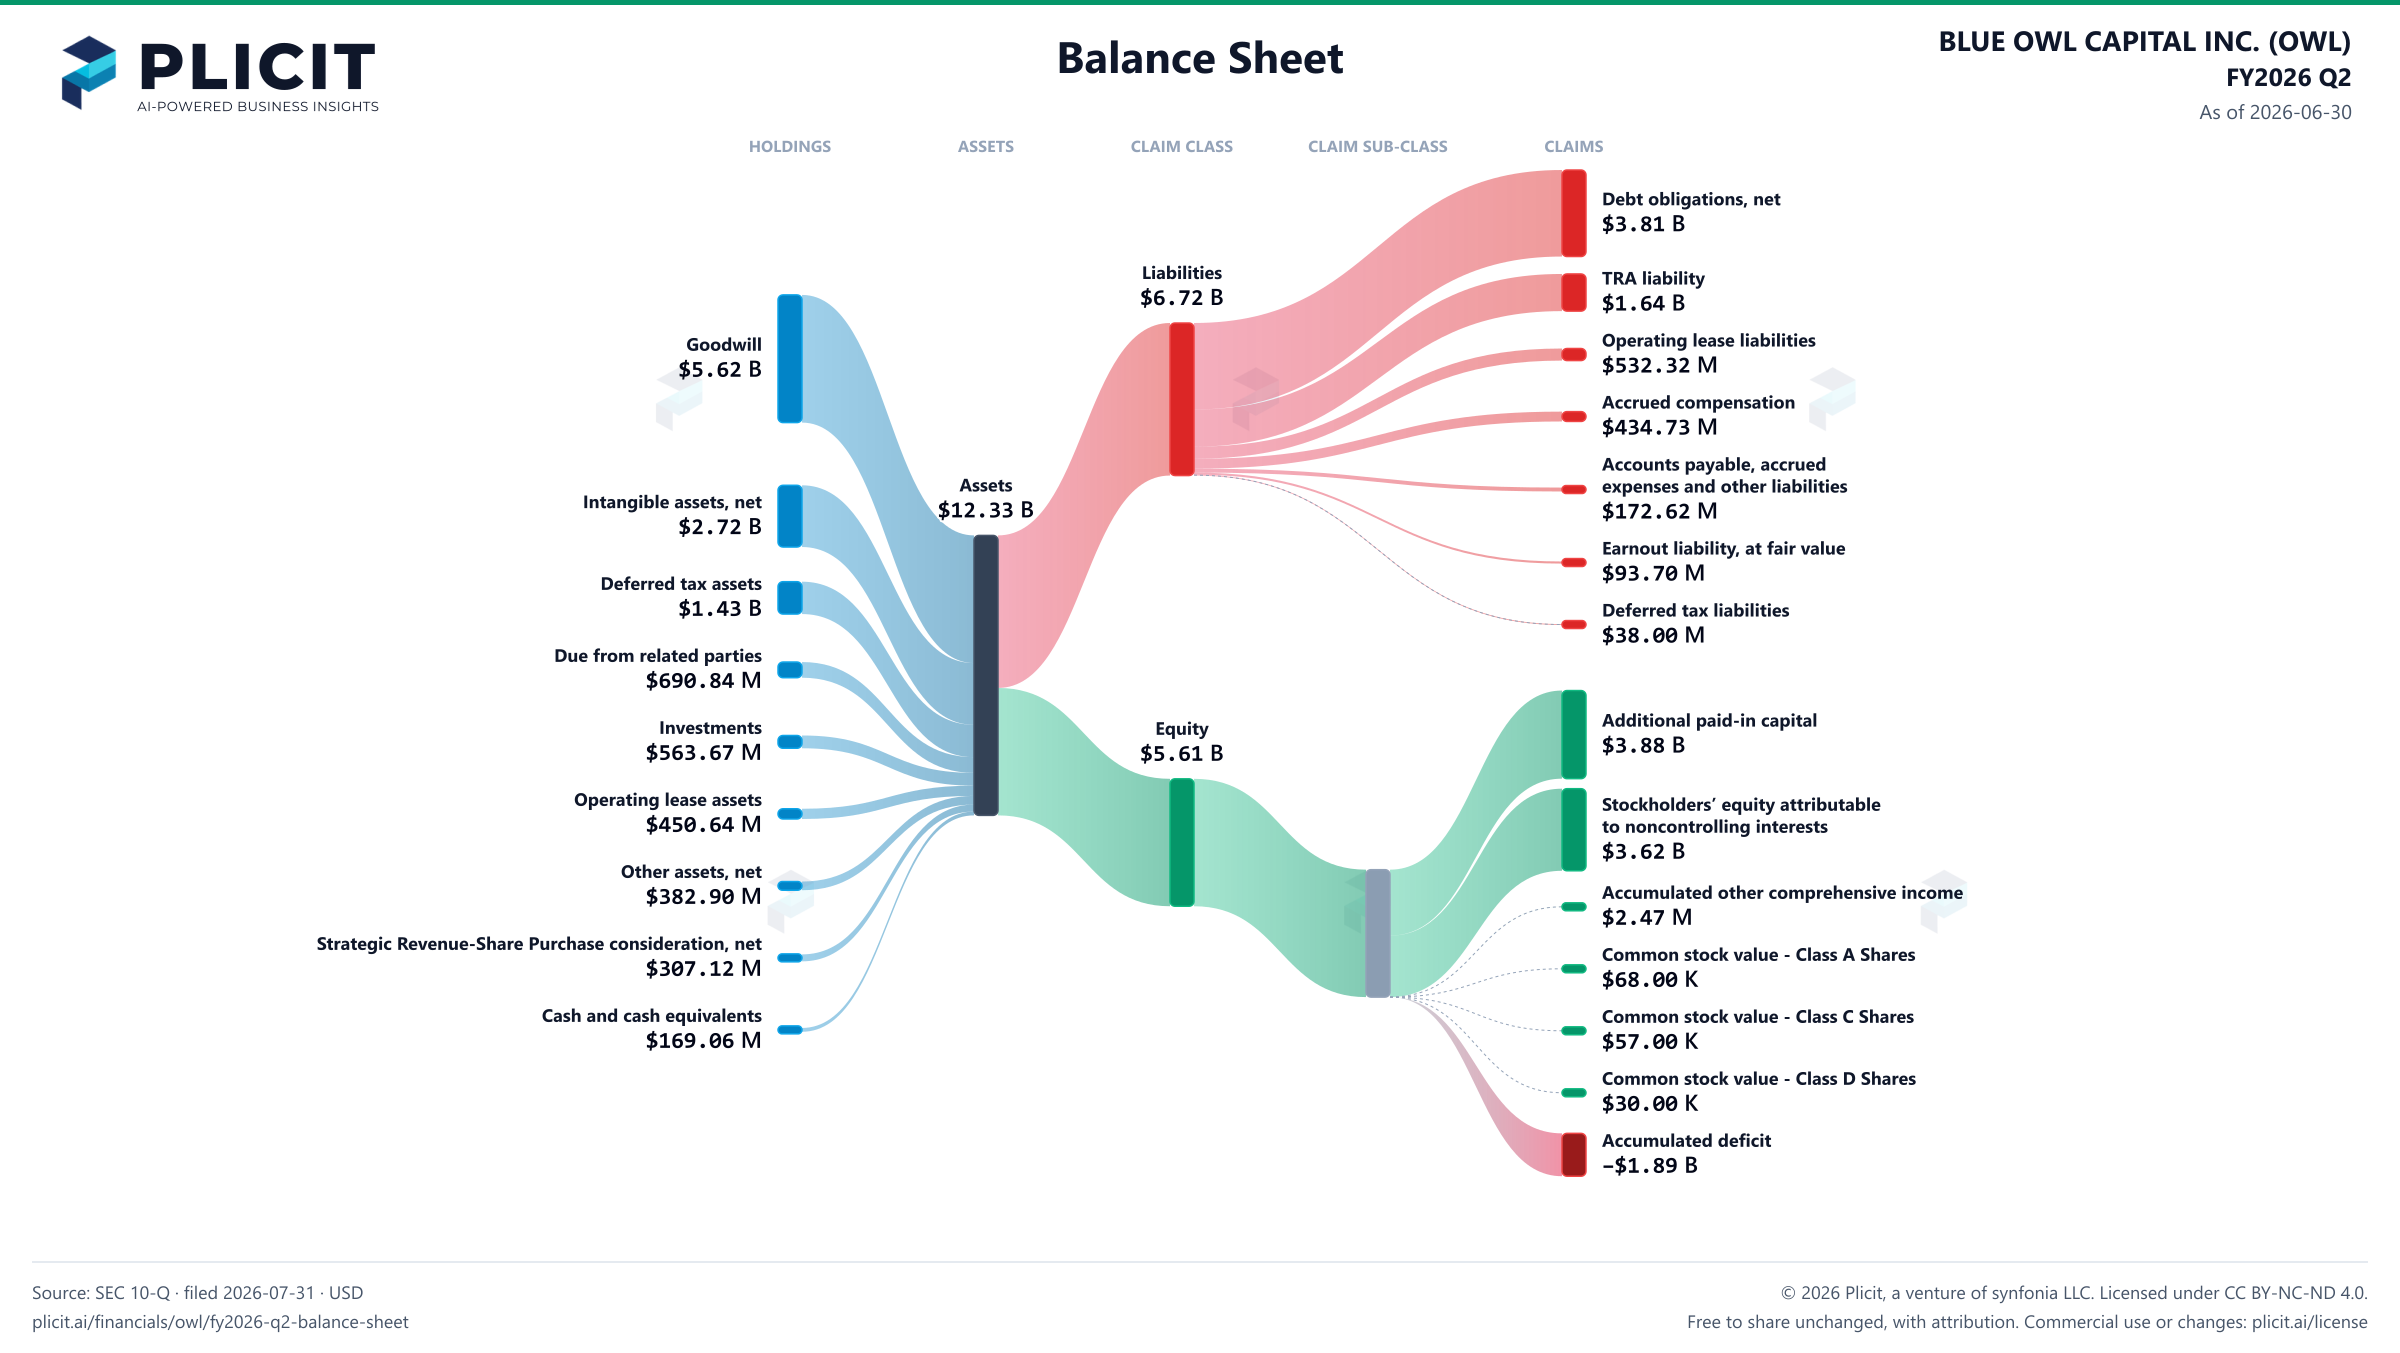
BLUE OWL CAPITAL INC. (OWL) FY2026 Q2 Balance Sheet Sankey chart
Free to share unchanged, with credit to Plicit.ai · CC BY-NC-ND 4.0Download PNG

Newsletter

Get the teardowns by email

Subscribe if you want the public-company teardowns in your inbox when they're released.

Product waitlist

Health Check and Teardown for your own company

A health check uncovers insights of your private books, not a public ticker. Join this list to get notified as soon as we go-live!