
PACIRA BIOSCIENCES, INC. (PCRX) FY2026 Q2 Balance Sheet

Balance Sheet

As of 2026-06-30

Swipe to see the full flow
PACIRA BIOSCIENCES, INC. (PCRX) FY2026 Q2 Balance SheetBalance sheet as of 2026-06-30. The chart shows assets, liabilities and equity at that date.Current liabilities$122.01 MLiabilities$572.00 MCurrent assets$615.22 MNon-current liabilities$449.99 MAssets$1.24 BEquity$671.98 MNon-current assets$628.76 MGross equity(calculated)$1.09 BHOLDINGSASSET CLASSASSETSCLAIM CLASSCLAIM SUB-CLASSCLAIMSCash and cash equivalentsInventories, netAccounts receivable, netAssets held for saleShort-term available-for-sale investmentsPrepaid expenses and other current assetsIntangible assets, netFixed assets, netDeferred tax assetsRight-of-use assets, netInvestments and other assetsGoodwillAccrued expensesAccounts payableLease liabilitiesLiabilities held for saleLong-term debt, netLease liabilitiesOther liabilitiesContingent considerationDeferred tax liabilitiesAdditional paid-in capitalAccumulated other comprehensive incomeCommon stock, par value $0.001; 250,000,000 shares authorized; 48,840,889 shares issued and 39,822,298 shares outstanding at June 30, 2026 and 47,890,777 shares issued and 41,116,739 shares outstanding at December 31, 2025Current assetsNon-current assetsAssetsCurrent liabilitiesNon-current liabilitiesLiabilitiesEquityGross equity (calculated)Treasury stock, at cost, inclusive of excise tax and broker fees, 9,018,591 and 6,774,038 shares at June 30, 2026 and December 31, 2025, respectivelyAccumulated deficitAccrued expensesAccrued expenses$93.50 MCurrent liabilitiesCurrent liabilities$122.01 MAccounts payableAccounts payable$17.51 MLease liabilitiesLease liabilities$10.30 MLiabilitiesLiabilities$572.00 MCash and cash equivalentsCash and cash equivalents$205.88 MCurrent assetsCurrent assets$615.22 MLiabilities held for saleLiabilities held for sale$705.00 KInventories, netInventories, net$134.58 MNon-current liabilitiesNon-current liabilities$449.99 MLong-term debt, netLong-term debt, net$363.12 MAssetsAssets$1.24 BAccounts receivable, netAccounts receivable, net$132.42 MAssets held for saleAssets held for sale$67.34 MLease liabilitiesLease liabilities$38.70 MShort-term available-for-sale investmentsShort-term available-for-sale investments$45.16 MOther liabilitiesOther liabilities$26.65 MPrepaid expenses and other current assetsPrepaid expenses and other current assets$29.85 MContingent considerationContingent consideration$17.45 MEquityEquity$671.98 MDeferred tax liabilitiesDeferred tax liabilities$4.07 MIntangible assets, netIntangible assets, net$285.48 MNon-current assetsNon-current assets$628.76 MGross equity (calculated)Gross equity(calculated)$1.09 BFixed assets, netFixed assets, net$130.28 MDeferred tax assetsDeferred tax assets$124.60 MAdditional paid-in capitalAdditional paid-in capital$1.09 BRight-of-use assets, netRight-of-use assets, net$44.92 MInvestments and other assetsInvestments and other assets$23.84 MGoodwillGoodwill$19.64 MAccumulated other comprehensive incomeAccumulated other comprehensive income$3.24 MCommon stock, par value $0.001; 250,000,000 shares authorized; 48,840,889 shares issued and 39,822,298 shares outstanding at June 30, 2026 and 47,890,777 shares issued and 41,116,739 shares outstanding at December 31, 2025Common stock$49.00 KTreasury stock, at cost, inclusive of excise tax and broker fees, 9,018,591 and 6,774,038 shares at June 30, 2026 and December 31, 2025, respectivelyTreasury stock−$227.01 MAccumulated deficitAccumulated deficit−$191.75 M
Chart details

PACIRA BIOSCIENCES, INC. (PCRX) FY2026 Q2 Balance Sheet

Balance sheet as of 2026-06-30. The chart shows assets, liabilities and equity at that date.

Assets
1,243,978,000 US dollars
Current assets
615,215,000 US dollars
Non-current assets
628,763,000 US dollars
Liabilities
572,002,000 US dollars
Current liabilities
122,011,000 US dollars
Non-current liabilities
449,991,000 US dollars
Equity
671,976,000 US dollars
Cash and cash equivalents
205,875,000 US dollars
Inventories, net
134,575,000 US dollars
Accounts receivable, net
132,420,000 US dollars
Assets held for sale
67,337,000 US dollars
Short-term available-for-sale investments
45,156,000 US dollars
Prepaid expenses and other current assets
29,852,000 US dollars
Intangible assets, net
285,484,000 US dollars
Fixed assets, net
130,277,000 US dollars
Deferred tax assets
124,598,000 US dollars
Right-of-use assets, net
44,920,000 US dollars
Investments and other assets
23,842,000 US dollars
Goodwill
19,642,000 US dollars
Accrued expenses
93,499,000 US dollars
Accounts payable
17,509,000 US dollars
Lease liabilities
10,298,000 US dollars
Liabilities held for sale
705,000 US dollars
Long-term debt, net
363,124,000 US dollars
Lease liabilities
38,695,000 US dollars
Other liabilities
26,650,000 US dollars
Contingent consideration
17,452,000 US dollars
Deferred tax liabilities
4,070,000 US dollars
Additional paid-in capital
1,087,452,000 US dollars
Accumulated other comprehensive income
3,241,000 US dollars
Common stock, par value $0.001; 250,000,000 shares authorized; 48,840,889 shares issued and 39,822,298 shares outstanding at June 30, 2026 and 47,890,777 shares issued and 41,116,739 shares outstanding at December 31, 2025
49,000 US dollars
Preferred stock, par value $0.001; 5,000,000 shares authorized; none issued and outstanding at June 30, 2026 and December 31, 2025
0 US dollars
Treasury stock, at cost, inclusive of excise tax and broker fees, 9,018,591 and 6,774,038 shares at June 30, 2026 and December 31, 2025, respectively
negative 227,013,000 US dollars
Accumulated deficit
negative 191,753,000 US dollars
Gross equity (calculated)
1,090,742,000 US dollars. Net equity plus the magnitudes of its negative contributions equals gross positive equity. The negative contributions enter this reconciliation as add-backs; their filed signs stay negative.

Chart connections

  • Assets equal liabilities plus consolidated equity. Consolidated equity includes noncontrolling interests when reported.
  • Treasury shares and other negative equity contributions reduce equity.
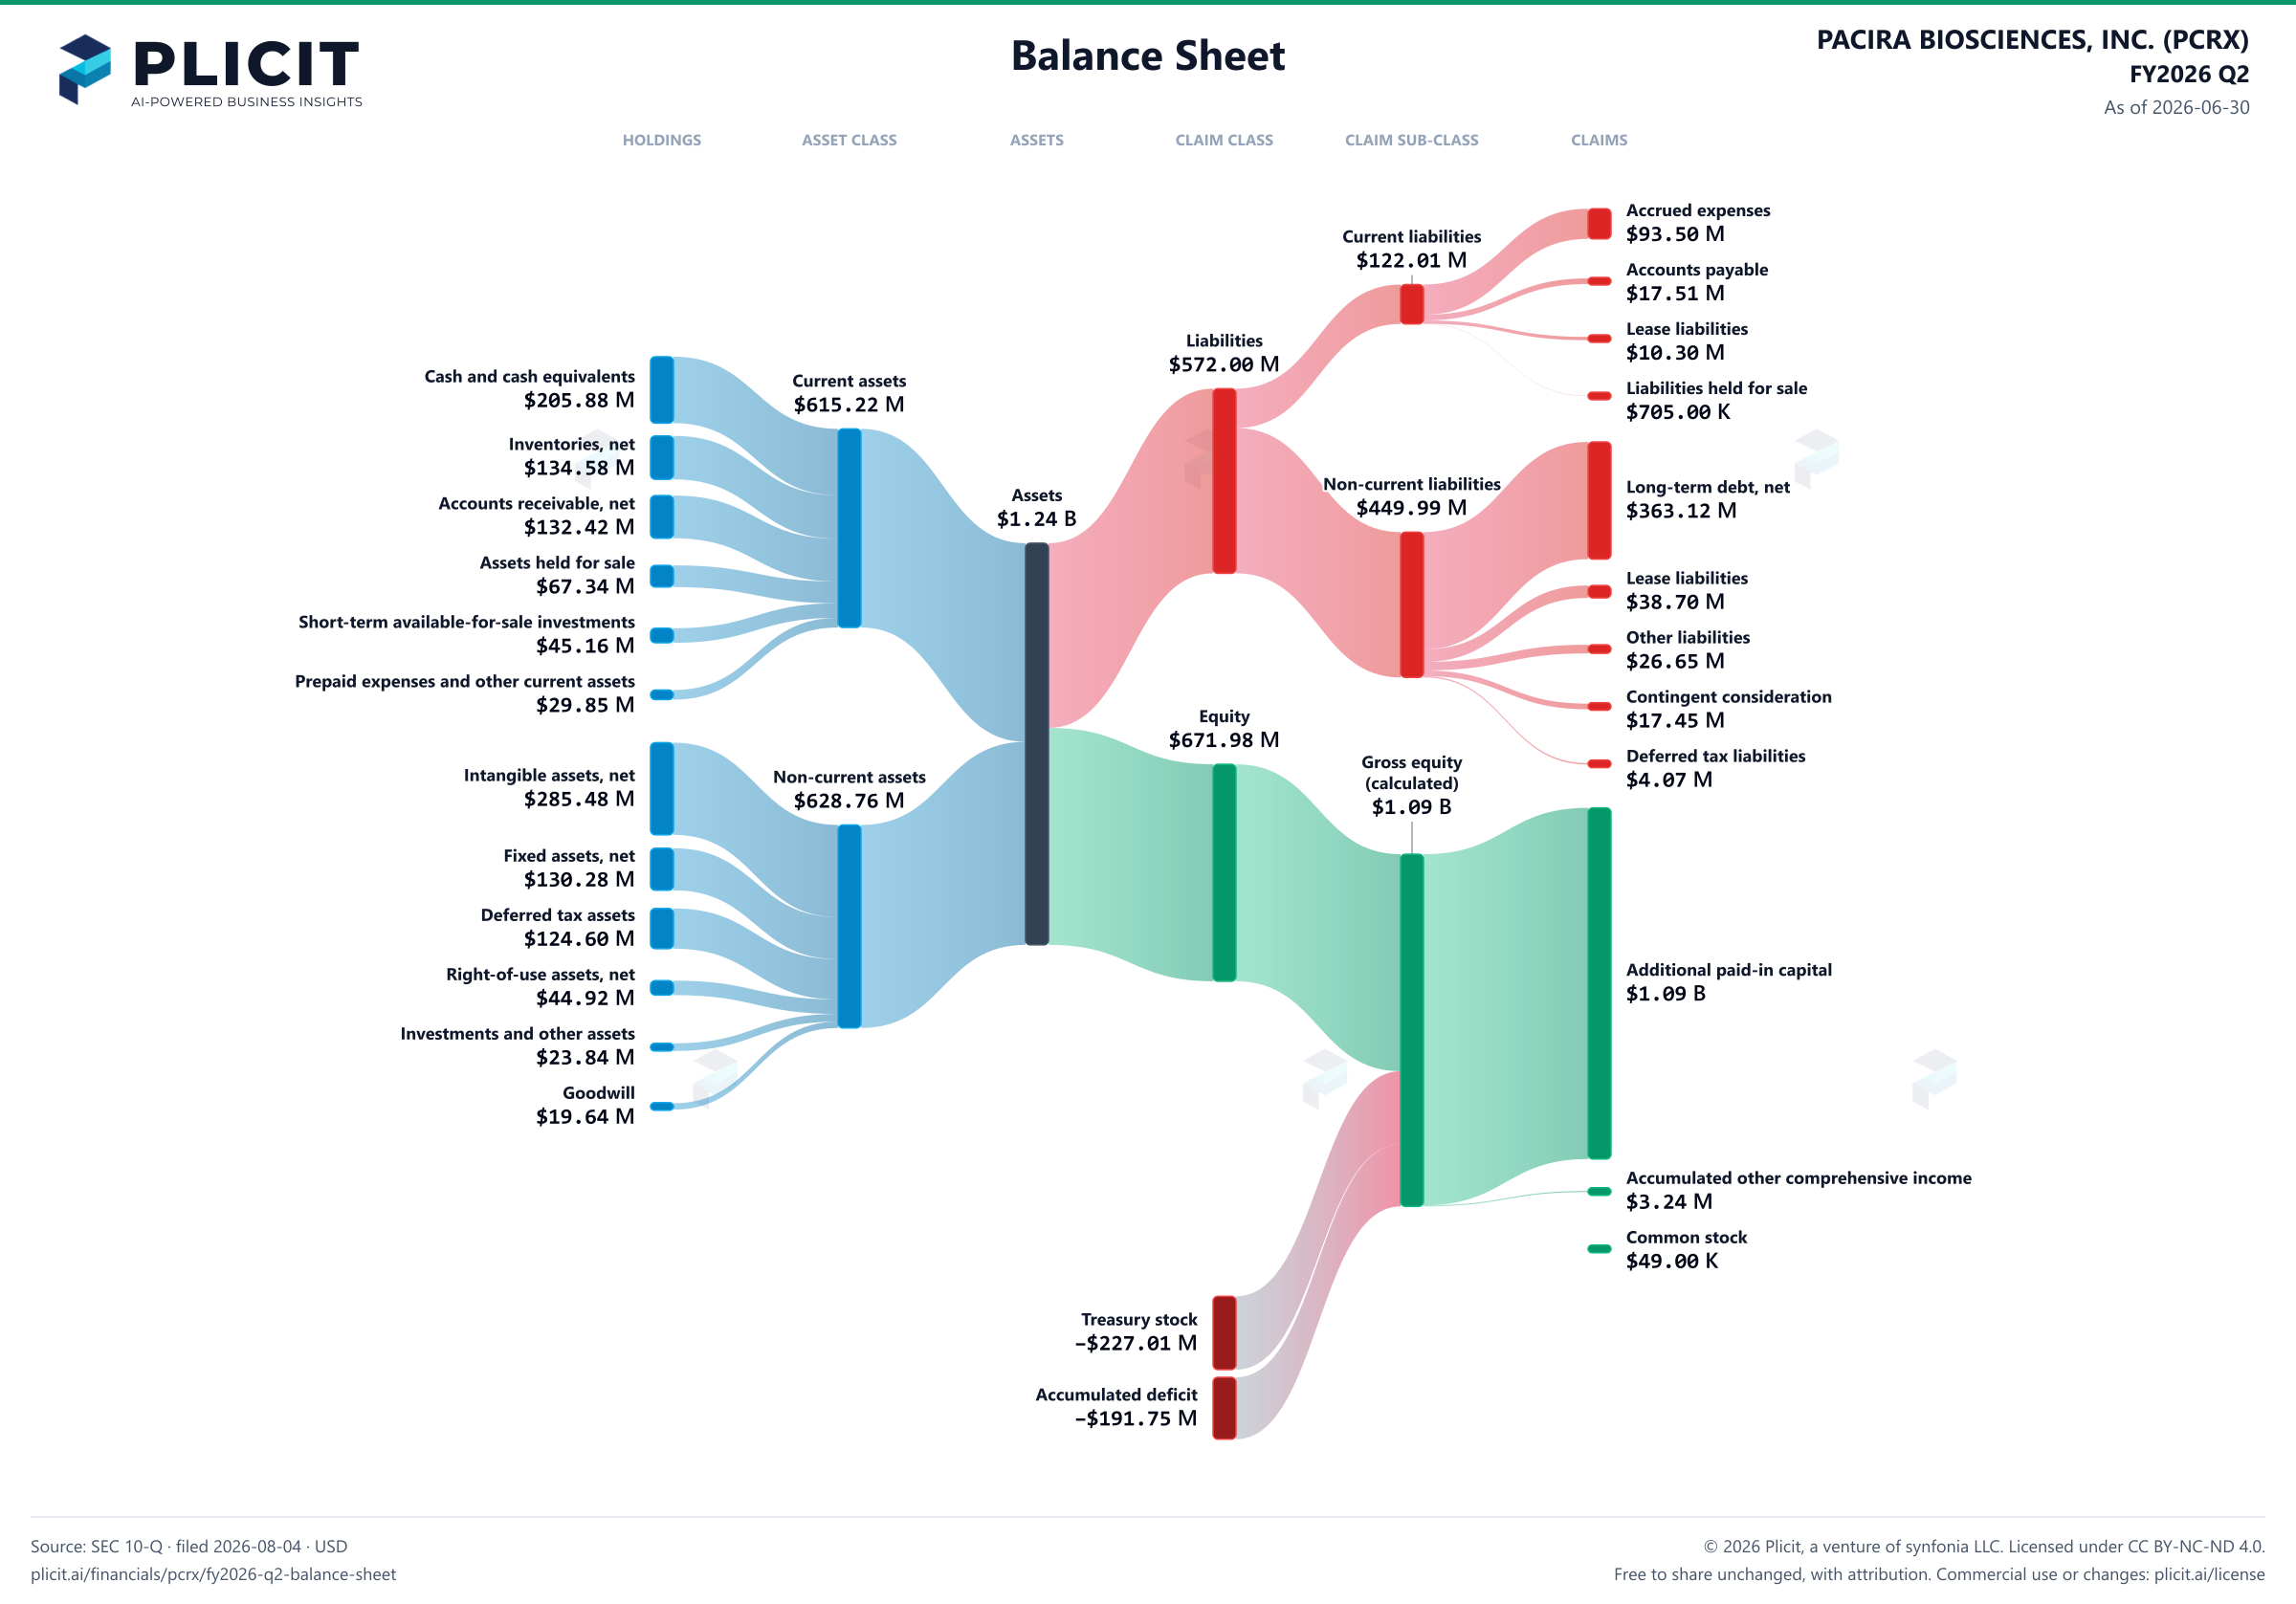
PACIRA BIOSCIENCES, INC. (PCRX) FY2026 Q2 Balance Sheet Sankey chart
Free to share unchanged, with credit to Plicit.ai · CC BY-NC-ND 4.0Download PNG

Newsletter

Get the teardowns by email

Subscribe if you want the public-company teardowns in your inbox when they're released.

Product waitlist

Health Check and Teardown for your own company

A health check uncovers insights of your private books, not a public ticker. Join this list to get notified as soon as we go-live!