
PepsiCo, Inc. (PEP) FY2026 Q3 Balance Sheet
As of 2026-09-05
Balance Sheet
As of 2026-09-05
Swipe to see the full flow
Chart details
PepsiCo, Inc. (PEP) FY2026 Q3 Balance Sheet
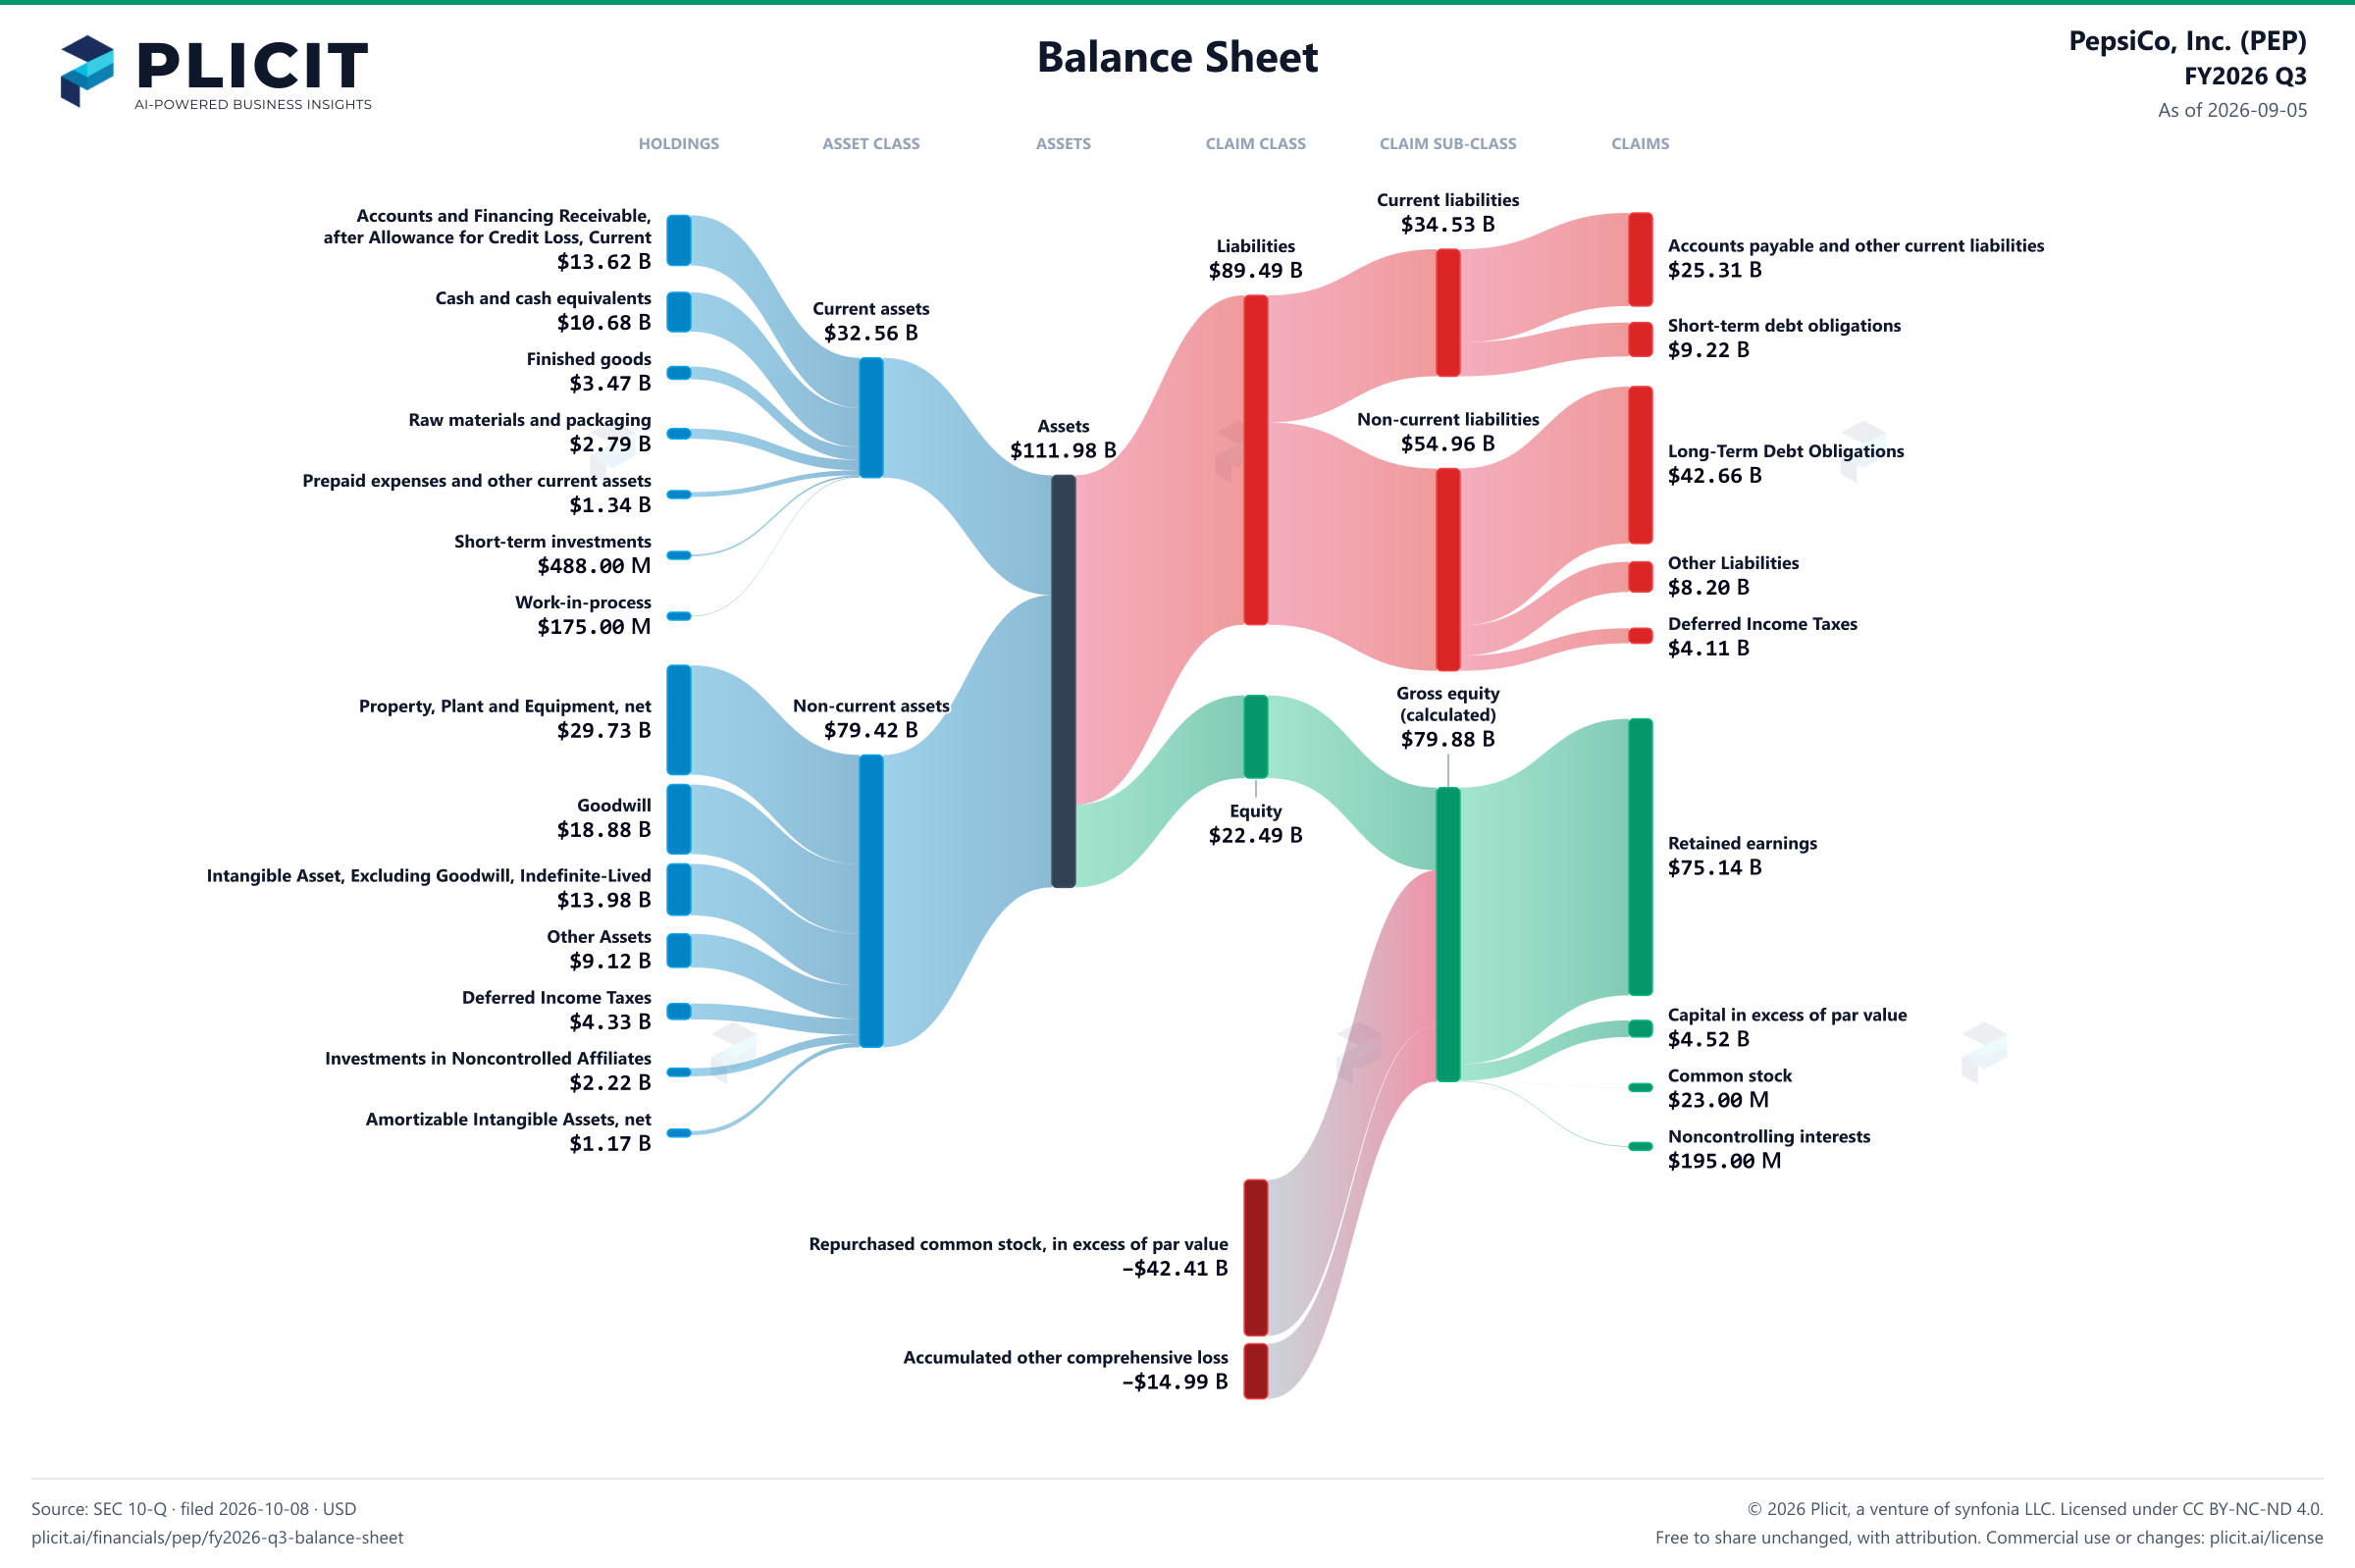
Balance sheet as of 2026-09-05. The chart shows assets, liabilities and equity at that date.
- Assets
- 111,976,000,000 US dollars
- Current assets
- 32,559,000,000 US dollars
- Non-current assets
- 79,417,000,000 US dollars
- Liabilities
- 89,489,000,000 US dollars
- Current liabilities
- 34,529,000,000 US dollars
- Non-current liabilities
- 54,960,000,000 US dollars
- Equity
- 22,487,000,000 US dollars
- Noncontrolling interest
- 195,000,000 US dollars. Included in consolidated equity; this amount is not added again.
- Property, plant and equipment
- 62,383,000,000 US dollars. Part of Property, Plant and Equipment, net, drawn as one net amount.
- Accumulated depreciation
- negative 32,652,000,000 US dollars. Part of Property, Plant and Equipment, net, drawn as one net amount.
- Accounts and Financing Receivable, after Allowance for Credit Loss, Current
- 13,623,000,000 US dollars
- Cash and cash equivalents
- 10,675,000,000 US dollars
- Finished goods
- 3,467,000,000 US dollars
- Raw materials and packaging
- 2,792,000,000 US dollars
- Prepaid expenses and other current assets
- 1,339,000,000 US dollars
- Short-term investments
- 488,000,000 US dollars
- Work-in-process
- 175,000,000 US dollars
- Property, Plant and Equipment, net
- 29,731,000,000 US dollars
- Goodwill
- 18,884,000,000 US dollars
- Intangible Asset, Excluding Goodwill, Indefinite-Lived
- 13,977,000,000 US dollars
- Other Assets
- 9,117,000,000 US dollars
- Deferred Income Taxes
- 4,328,000,000 US dollars
- Investments in Noncontrolled Affiliates
- 2,215,000,000 US dollars
- Amortizable Intangible Assets, net
- 1,165,000,000 US dollars
- Accounts payable and other current liabilities
- 25,306,000,000 US dollars
- Short-term debt obligations
- 9,223,000,000 US dollars
- Long-Term Debt Obligations
- 42,658,000,000 US dollars
- Other Liabilities
- 8,195,000,000 US dollars
- Deferred Income Taxes
- 4,107,000,000 US dollars
- Retained earnings
- 75,140,000,000 US dollars
- Capital in excess of par value
- 4,522,000,000 US dollars
- Common stock, par value 12/3¢ per share (authorized 3,600 shares; issued, net of repurchased common stock at par value: 1,364 and 1,367 shares, respectively)
- 23,000,000 US dollars
- Noncontrolling interests
- 195,000,000 US dollars
- Repurchased common stock, in excess of par value (503 and 500 shares, respectively)
- negative 42,406,000,000 US dollars
- Accumulated other comprehensive loss
- negative 14,987,000,000 US dollars
- Gross equity (calculated)
- 79,880,000,000 US dollars. Net equity plus the magnitudes of its negative contributions equals gross positive equity. The negative contributions enter this reconciliation as add-backs; their filed signs stay negative.
Chart connections
- Assets equal liabilities plus consolidated equity. Consolidated equity includes noncontrolling interests when reported.
- Treasury shares and other negative equity contributions reduce equity.
Free to share unchanged, with credit to Plicit.ai · CC BY-NC-ND 4.0Download PNG
Product waitlist
Health Check and Teardown for your own company
A health check uncovers insights of your private books, not a public ticker. Join this list to get notified as soon as we go-live!