
PROCTER & GAMBLE CO (PG) FY2025 Q1 Balance Sheet
As of 2024-09-30
Balance Sheet
As of 2024-09-30
Swipe to see the full flow
Chart details
PROCTER & GAMBLE CO (PG) FY2025 Q1 Balance Sheet
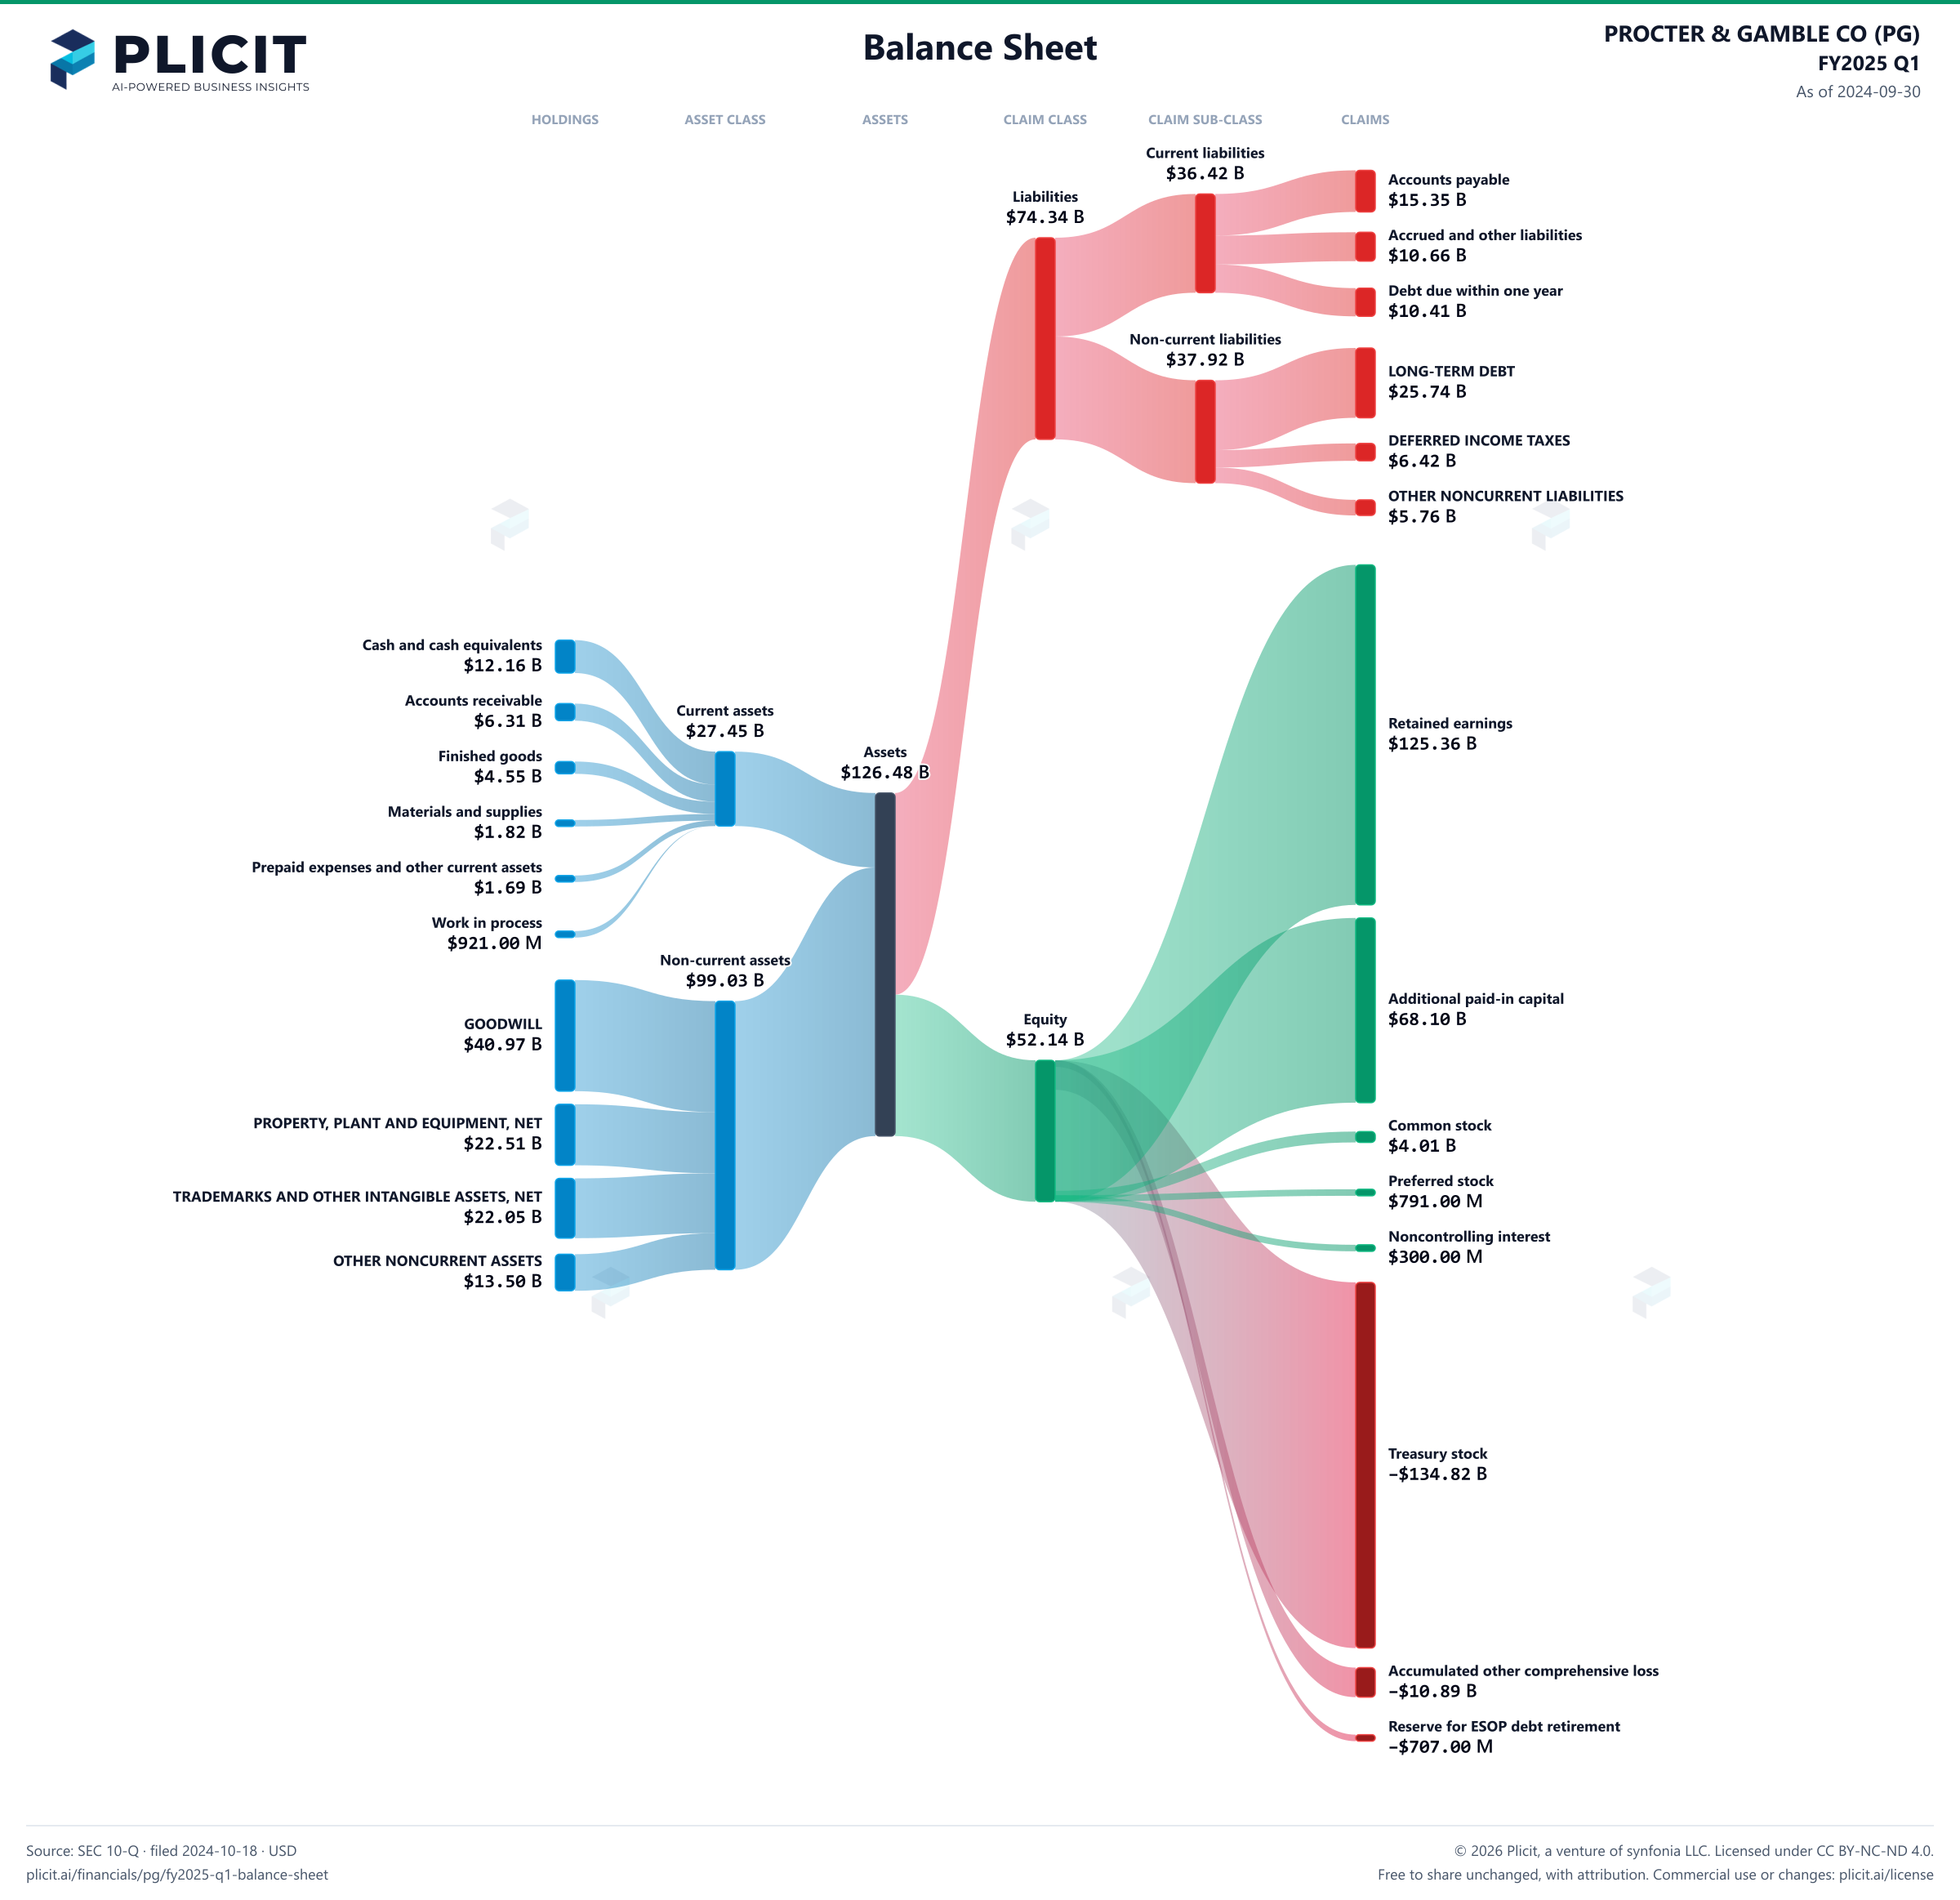
Balance sheet as of 2024-09-30. The chart shows assets, liabilities and equity at that date.
- Assets
- 126,482,000,000 US dollars
- Current assets
- 27,449,000,000 US dollars
- Non-current assets
- 99,033,000,000 US dollars
- Liabilities
- 74,341,000,000 US dollars
- Current liabilities
- 36,420,000,000 US dollars
- Non-current liabilities
- 37,921,000,000 US dollars
- Equity
- 52,141,000,000 US dollars
- Noncontrolling interest
- 300,000,000 US dollars. Included in consolidated equity; this amount is not added again.
- Cash and cash equivalents
- 12,156,000,000 US dollars
- Accounts receivable
- 6,314,000,000 US dollars
- Finished goods
- 4,546,000,000 US dollars
- Materials and supplies
- 1,820,000,000 US dollars
- Prepaid expenses and other current assets
- 1,692,000,000 US dollars
- Work in process
- 921,000,000 US dollars
- GOODWILL
- 40,970,000,000 US dollars
- PROPERTY, PLANT AND EQUIPMENT, NET
- 22,506,000,000 US dollars
- TRADEMARKS AND OTHER INTANGIBLE ASSETS, NET
- 22,053,000,000 US dollars
- OTHER NONCURRENT ASSETS
- 13,503,000,000 US dollars
- Accounts payable
- 15,350,000,000 US dollars
- Accrued and other liabilities
- 10,661,000,000 US dollars
- Debt due within one year
- 10,409,000,000 US dollars
- LONG-TERM DEBT
- 25,744,000,000 US dollars
- DEFERRED INCOME TAXES
- 6,420,000,000 US dollars
- OTHER NONCURRENT LIABILITIES
- 5,757,000,000 US dollars
- Retained earnings
- 125,361,000,000 US dollars
- Additional paid-in capital
- 68,102,000,000 US dollars
- Common stock
- 4,009,000,000 US dollars
- Preferred stock
- 791,000,000 US dollars
- Noncontrolling interest
- 300,000,000 US dollars
- Treasury stock
- negative 134,823,000,000 US dollars
- Accumulated other comprehensive loss
- negative 10,893,000,000 US dollars
- Reserve for ESOP debt retirement
- negative 707,000,000 US dollars
Chart connections
- Assets equal liabilities plus consolidated equity. Consolidated equity includes noncontrolling interests when reported.
- Treasury shares and other negative equity contributions reduce equity.
- The filed non-current assets lines add up to $99,032.00 M and the non-current assets total is $99,033.00 M; the $1.00 M difference is within the rounding of the filed amounts.
- The filed equity lines add up to $52,140.00 M and the equity total is $52,141.00 M; the $1.00 M difference is within the rounding of the filed amounts.
Free to share unchanged, with credit to Plicit.ai · CC BY-NC-ND 4.0Download PNG
Product waitlist
Health Check and Teardown for your own company
A health check uncovers insights of your private books, not a public ticker. Join this list to get notified as soon as we go-live!