
PARKER-HANNIFIN CORPORATION (PH) FY2025 Q1 Balance Sheet
As of 2024-09-30
Balance Sheet
As of 2024-09-30
Swipe to see the full flow
Chart details
PARKER-HANNIFIN CORPORATION (PH) FY2025 Q1 Balance Sheet
Balance sheet as of 2024-09-30. The chart shows assets, liabilities and equity at that date.
- Assets
- 29,600,835,000 US dollars
- Current assets
- 7,033,701,000 US dollars
- Non-current assets
- 22,567,134,000 US dollars
- Liabilities
- 16,699,486,000 US dollars
- Current liabilities
- 7,338,030,000 US dollars
- Non-current liabilities
- 9,361,456,000 US dollars
- Equity
- 12,901,349,000 US dollars
- Noncontrolling interest
- 9,449,000 US dollars. Included in consolidated equity; this amount is not added again.
- Property, plant and equipment
- 7,111,027,000 US dollars. Part of Property, plant and equipment, net, drawn as one net amount.
- Less: Accumulated depreciation
- negative 4,271,485,000 US dollars. Part of Property, plant and equipment, net, drawn as one net amount.
- Inventories
- 2,872,250,000 US dollars
- Trade accounts receivable, net
- 2,712,656,000 US dollars
- Other current assets
- 511,198,000 US dollars
- Cash and cash equivalents
- 371,068,000 US dollars
- Non-trade and notes receivable
- 317,381,000 US dollars
- Prepaid expenses
- 249,148,000 US dollars
- Goodwill
- 10,625,287,000 US dollars
- Intangible assets, net
- 7,747,233,000 US dollars
- Property, plant and equipment, net
- 2,839,542,000 US dollars
- Investments and other assets
- 1,263,190,000 US dollars
- Deferred income taxes
- 91,882,000 US dollars
- Notes payable and long-term debt payable within one year
- 3,515,613,000 US dollars
- Accounts payable, trade
- 1,953,477,000 US dollars
- Other accrued liabilities
- 1,004,073,000 US dollars
- Accrued domestic and foreign taxes
- 457,761,000 US dollars
- Accrued payrolls and other compensation
- 407,106,000 US dollars
- Long-term debt
- 6,673,303,000 US dollars
- Deferred income taxes
- 1,544,503,000 US dollars
- Other liabilities
- 715,948,000 US dollars
- Pensions and other postretirement benefits
- 427,702,000 US dollars
- Retained earnings
- 19,593,082,000 US dollars
- Additional paid-in capital
- 275,019,000 US dollars
- Common stock, $.50 par value; authorized 600,000,000 shares; issued 181,046,128 shares at September 30 and June 30
- 90,523,000 US dollars
- Serial preferred stock, $.50 par value; authorized 3,000,000 shares; none issued
- 0 US dollars
- Noncontrolling interests
- 9,449,000 US dollars
- Treasury shares, at cost; 52,325,695 shares at September 30 and 52,442,162 shares at June 30
- negative 5,976,289,000 US dollars
- Accumulated other comprehensive (loss)
- negative 1,090,435,000 US dollars
- Gross equity (calculated)
- 19,968,073,000 US dollars. Net equity plus the magnitudes of its negative contributions equals gross positive equity. The negative contributions enter this reconciliation as add-backs; their filed signs stay negative.
Chart connections
- Assets equal liabilities plus consolidated equity. Consolidated equity includes noncontrolling interests when reported.
- Treasury shares and other negative equity contributions reduce equity.
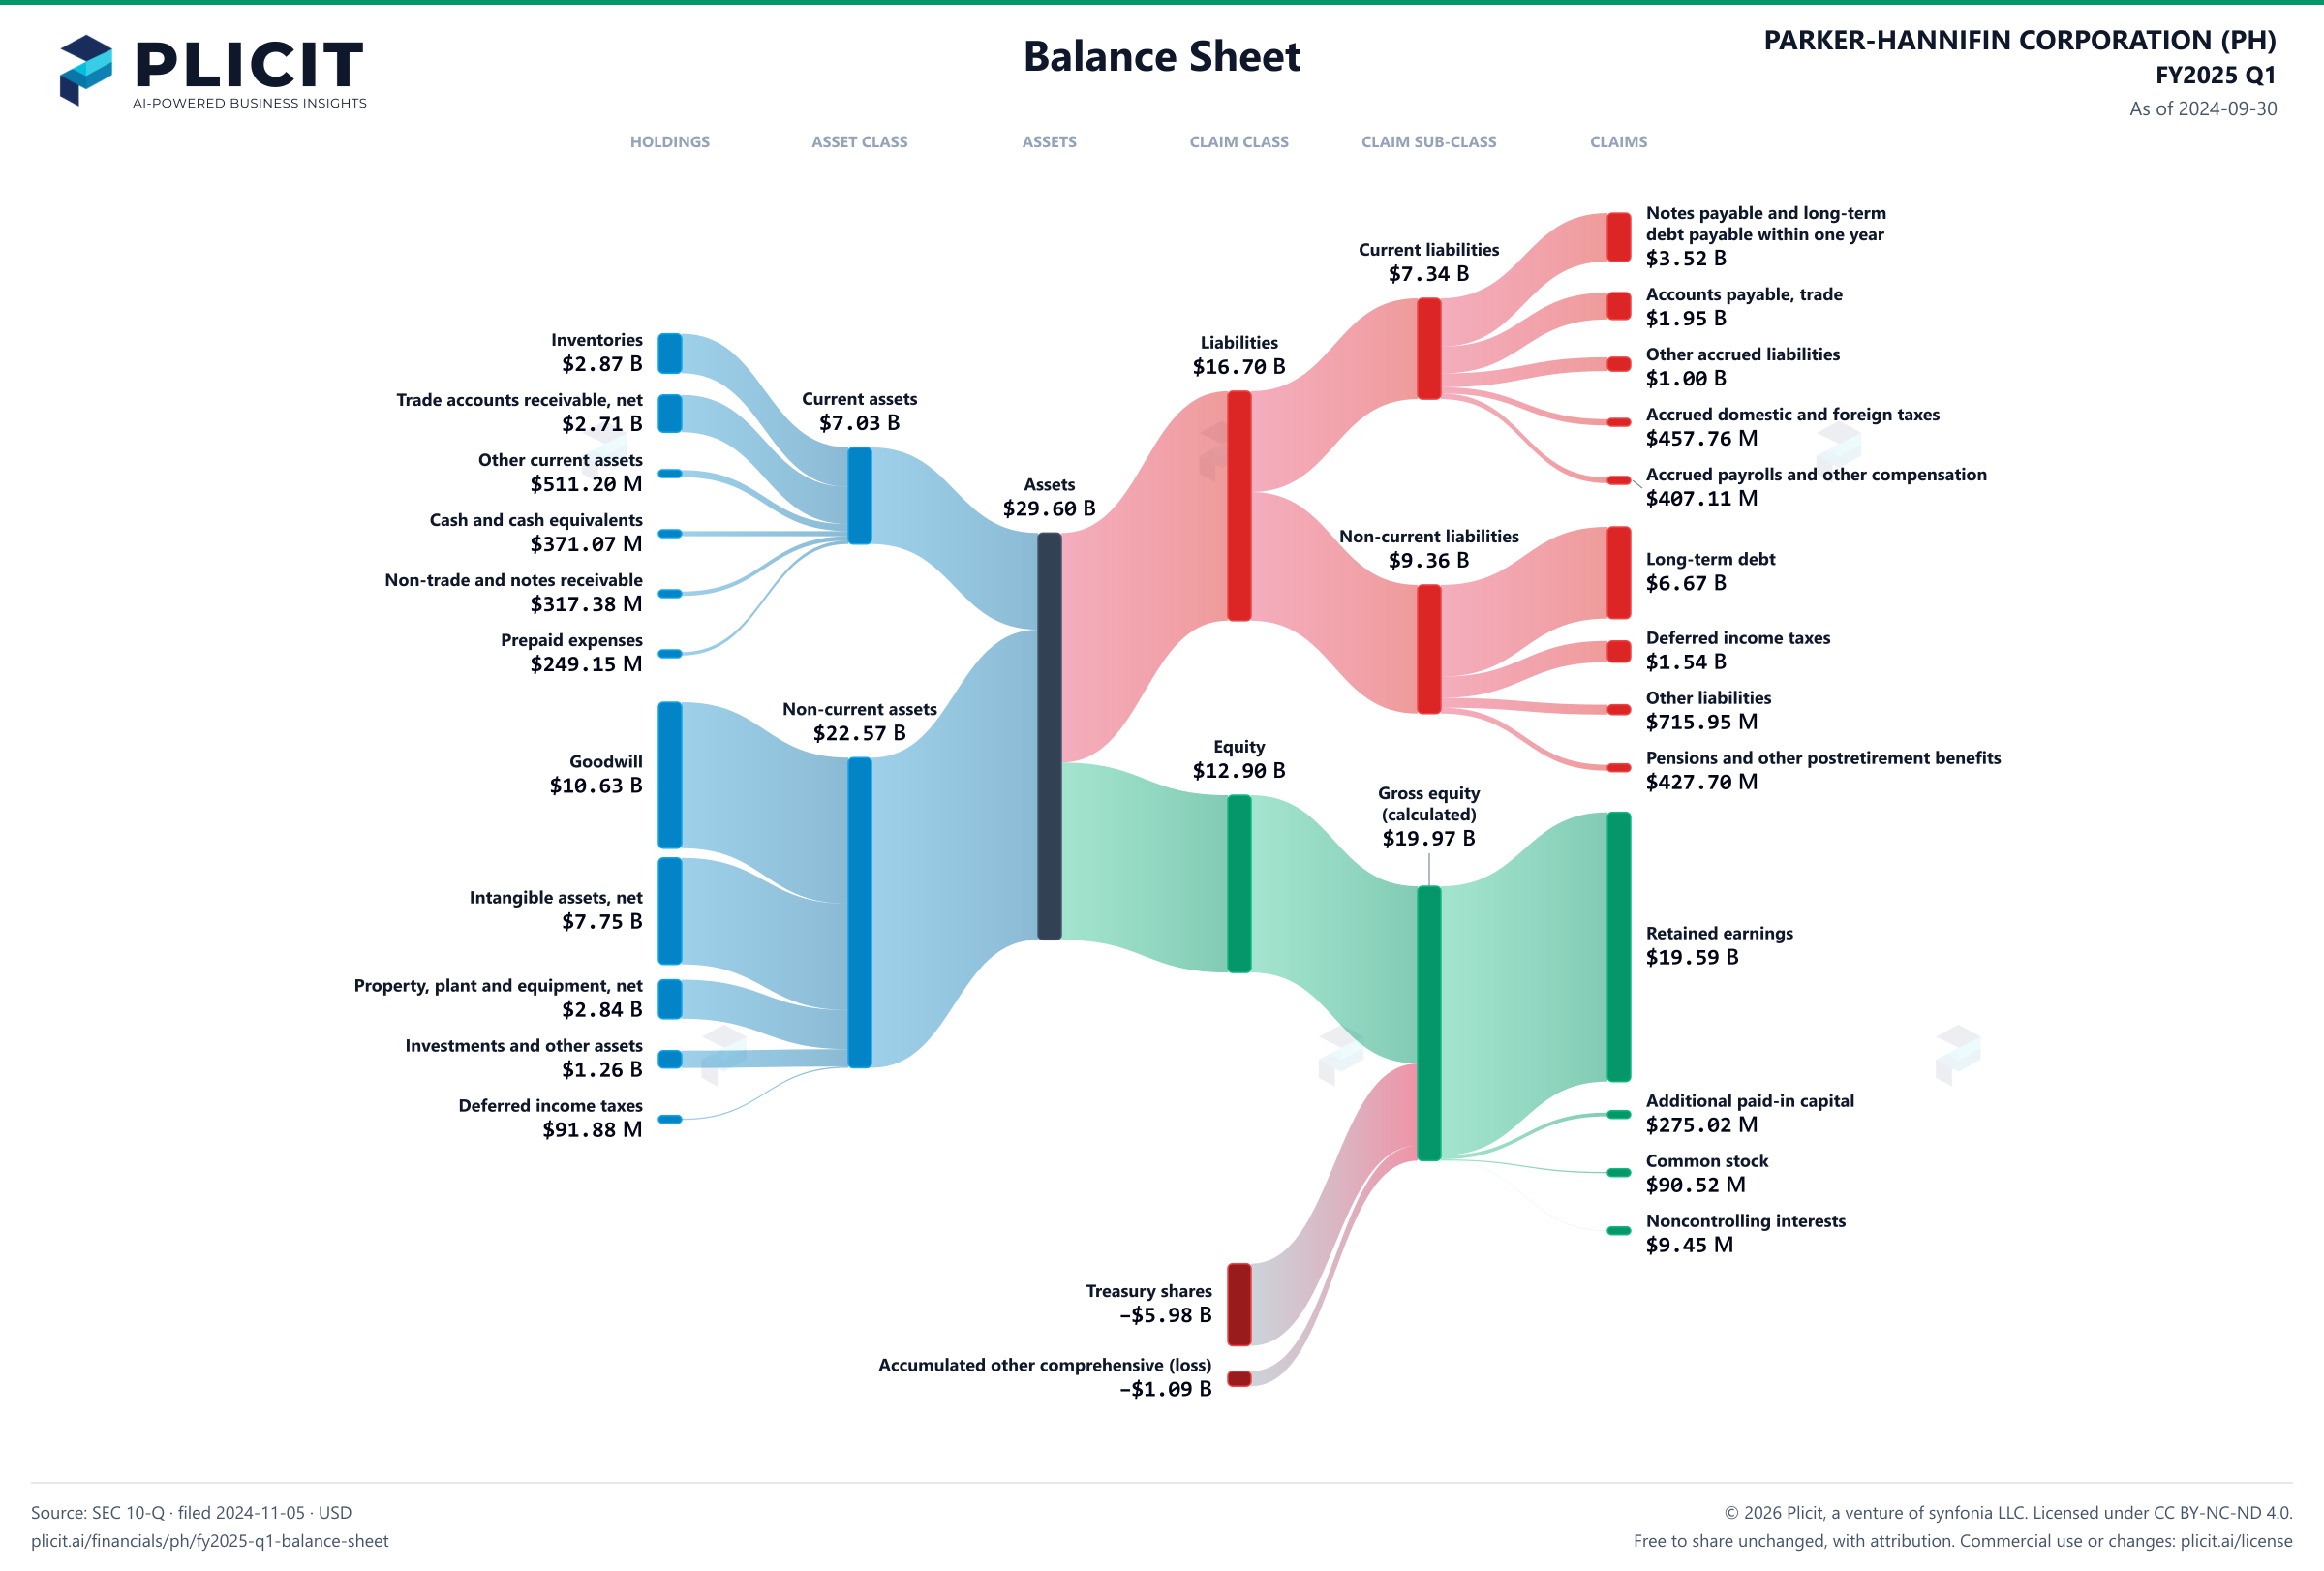
Free to share unchanged, with credit to Plicit.ai · CC BY-NC-ND 4.0Download PNG
Product waitlist
Health Check and Teardown for your own company
A health check uncovers insights of your private books, not a public ticker. Join this list to get notified as soon as we go-live!