
PNC Financial Services Group, Inc. (PNC) FY2026 Q2 Balance Sheet
As of 2026-06-30
Balance Sheet
As of 2026-06-30
Swipe to see the full flow
Chart details
PNC Financial Services Group, Inc. (PNC) FY2026 Q2 Balance Sheet
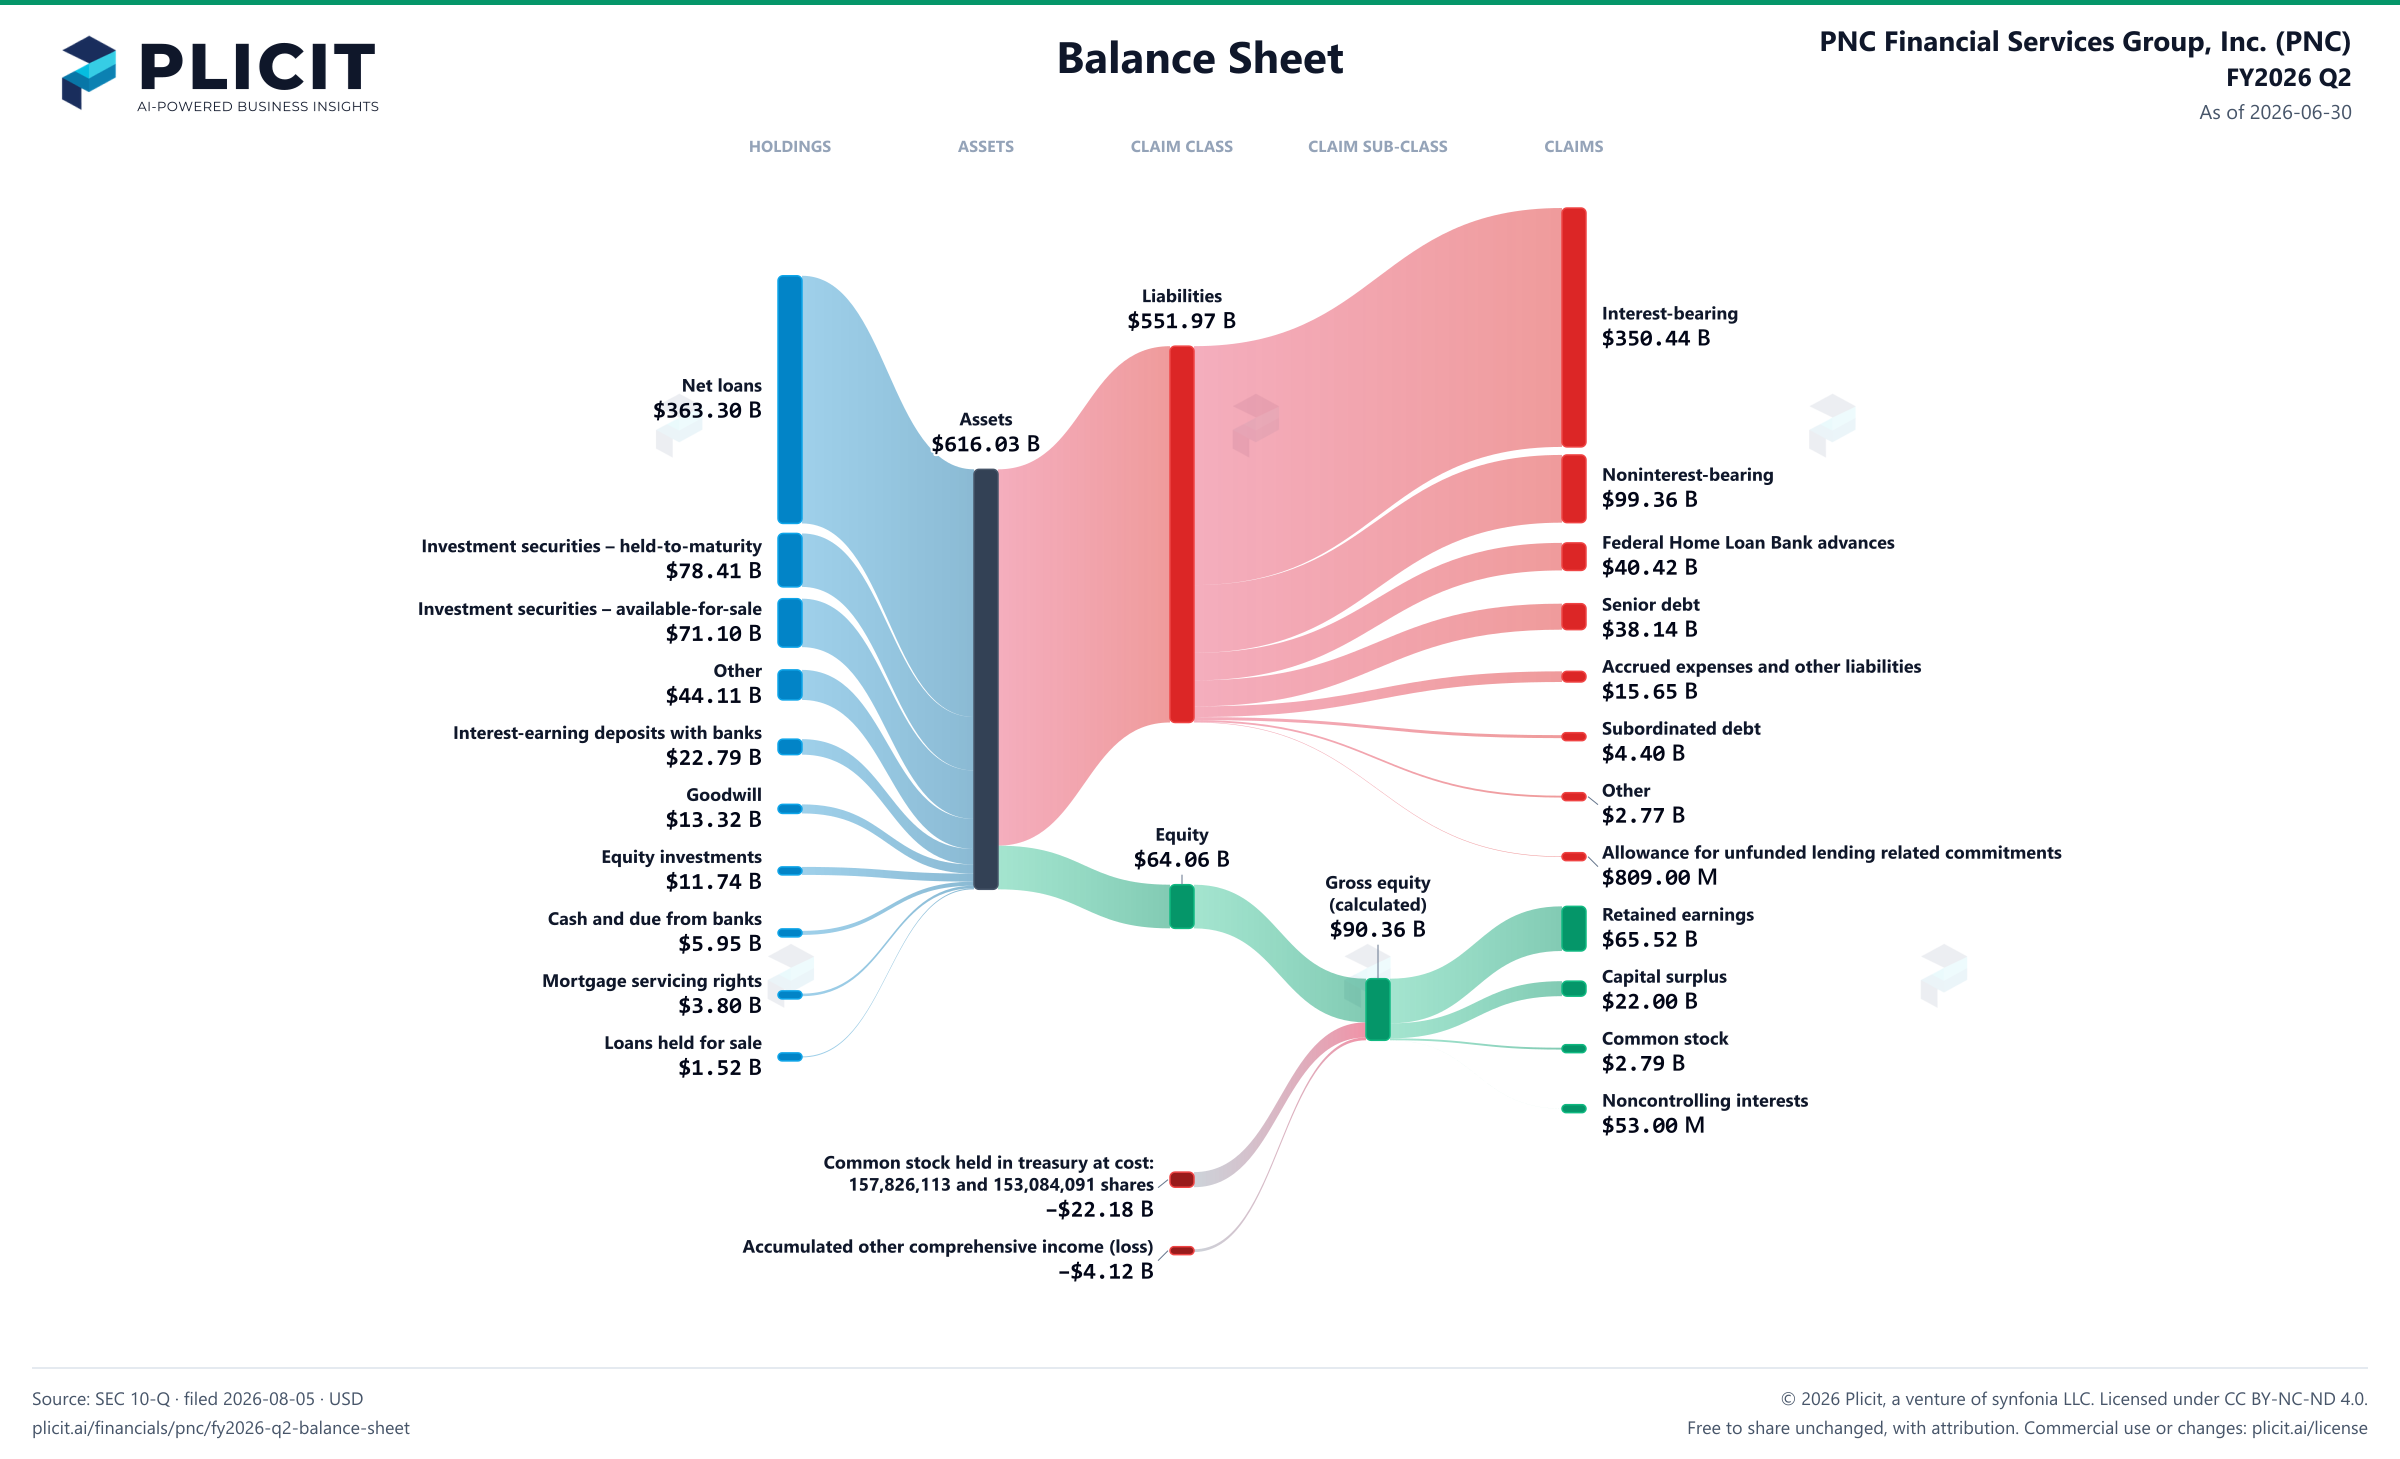
Balance sheet as of 2026-06-30. The chart shows assets, liabilities and equity at that date.
- Assets
- 616,034,000,000 US dollars
- Liabilities
- 551,973,000,000 US dollars
- Equity
- 64,061,000,000 US dollars
- Noncontrolling interest
- 53,000,000 US dollars. Included in consolidated equity; this amount is not added again.
- Loans
- 367,953,000,000 US dollars. Part of Net loans, drawn as one net amount.
- Allowance for loan and lease losses
- negative 4,652,000,000 US dollars. Part of Net loans, drawn as one net amount.
- Net loans
- 363,301,000,000 US dollars
- Investment securities – held-to-maturity
- 78,406,000,000 US dollars
- Investment securities – available-for-sale
- 71,100,000,000 US dollars
- Other
- 44,107,000,000 US dollars
- Interest-earning deposits with banks
- 22,794,000,000 US dollars
- Goodwill
- 13,317,000,000 US dollars
- Equity investments
- 11,735,000,000 US dollars
- Cash and due from banks
- 5,951,000,000 US dollars
- Mortgage servicing rights
- 3,801,000,000 US dollars
- Loans held for sale
- 1,522,000,000 US dollars
- Interest-bearing
- 350,436,000,000 US dollars
- Noninterest-bearing
- 99,356,000,000 US dollars
- Federal Home Loan Bank advances
- 40,416,000,000 US dollars
- Senior debt
- 38,144,000,000 US dollars
- Accrued expenses and other liabilities
- 15,649,000,000 US dollars
- Subordinated debt
- 4,396,000,000 US dollars
- Other
- 2,767,000,000 US dollars
- Allowance for unfunded lending related commitments
- 809,000,000 US dollars
- Retained earnings
- 65,518,000,000 US dollars
- Capital surplus
- 21,999,000,000 US dollars
- Common stock ($5 par value, Authorized 800,000,000 shares, issued 557,291,838 and 543,497,966 shares)
- 2,786,000,000 US dollars
- Preferred stock
- 0 US dollars
- Noncontrolling interests
- 53,000,000 US dollars
- Common stock held in treasury at cost: 157,826,113 and 153,084,091 shares
- negative 22,175,000,000 US dollars
- Accumulated other comprehensive income (loss)
- negative 4,120,000,000 US dollars
- Gross equity (calculated)
- 90,356,000,000 US dollars. Net equity plus the magnitudes of its negative contributions equals gross positive equity. The negative contributions enter this reconciliation as add-backs; their filed signs stay negative.
Chart connections
- Assets equal liabilities plus consolidated equity. Consolidated equity includes noncontrolling interests when reported.
- Treasury shares and other negative equity contributions reduce equity.
Free to share unchanged, with credit to Plicit.ai · CC BY-NC-ND 4.0Download PNG
Product waitlist
Health Check and Teardown for your own company
A health check uncovers insights of your private books, not a public ticker. Join this list to get notified as soon as we go-live!