
THE PENNANT GROUP, INC. (PNTG) FY2026 Q2 Balance Sheet

Balance Sheet

As of 2026-06-30

Swipe to see the full flow
THE PENNANT GROUP, INC. (PNTG) FY2026 Q2 Balance SheetBalance sheet as of 2026-06-30. The chart shows assets, liabilities and equity at that date.Current liabilities$152.41 MCurrent assets$183.59 MLiabilities$632.85 MAssets$1.04 BNon-current liabilities$480.44 MNon-current assets$853.70 MEquity$404.44 MGross equity(calculated)$404.51 MHOLDINGSASSET CLASSASSETSCLAIM CLASSCLAIM SUB-CLASSCLAIMSAccounts receivable—less allowance for credit losses of $766 and $681, at June 30, 2026 and December 31, 2025, respectivelyPrepaid expenses and other current assetsCashOperating lease right-of-use assetsGoodwillOther indefinite-lived intangiblesProperty and equipment, netEquity method investmentRestricted and other assetsDeferred tax assets, netAccrued wages and related liabilitiesOther accrued liabilitiesOperating lease liabilities—currentAccounts payableCurrent maturities of long-term debtLong-term operating lease liabilities—less current portionLong-term debtOther long-term liabilitiesDeferred tax liabilities, netAdditional paid-in capitalRetained earningsCommon stock, $0.001 par value; 100,000 shares authorized; 35,081 and 34,848 shares issued and outstanding, respectively, at June 30, 2026; and 34,878 and 34,626 shares issued and outstanding, respectively, at December 31, 2025Noncontrolling interestCurrent assetsNon-current assetsAssetsCurrent liabilitiesNon-current liabilitiesLiabilitiesEquityGross equity (calculated)Treasury stock, at cost, 3 shares at June 30, 2026 and December 31, 2025Accrued wages and related liabilitiesAccrued wages and related liabilities$60.47 MCurrent liabilitiesCurrent liabilities$152.41 MOther accrued liabilitiesOther accrued liabilities$34.14 MCurrent assetsCurrent assets$183.59 MAccounts receivable—less allowance for credit losses of $766 and $681, at June 30, 2026 and December 31, 2025, respectivelyAccounts receivable—less allowancefor credit losses of $766 and $681$133.18 MOperating lease liabilities—currentOperating lease liabilities—current$26.55 MLiabilitiesLiabilities$632.85 MPrepaid expenses and other current assetsPrepaid expenses and other current assets$35.14 MAccounts payableAccounts payable$26.24 MAssetsAssets$1.04 BCashCash$15.27 MCurrent maturities of long-term debtCurrent maturities of long-term debt$5.00 MNon-current liabilitiesNon-current liabilities$480.44 MLong-term operating lease liabilities—less current portionLong-term operating leaseliabilities—less current portion$263.36 MOperating lease right-of-use assetsOperating lease right-of-use assets$286.24 MNon-current assetsNon-current assets$853.70 MLong-term debtLong-term debt$192.50 MGoodwillGoodwill$235.79 MOther long-term liabilitiesOther long-term liabilities$22.78 MEquityEquity$404.44 MOther indefinite-lived intangiblesOther indefinite-lived intangibles$199.44 MDeferred tax liabilities, netDeferred tax liabilities, net$1.80 MGross equity (calculated)Gross equity(calculated)$404.51 MProperty and equipment, netProperty and equipment, net$75.30 MAdditional paid-in capitalAdditional paid-in capital$254.83 MEquity method investmentEquity method investment$28.80 MRestricted and other assetsRestricted and other assets$27.29 MRetained earningsRetained earnings$104.40 MDeferred tax assets, netDeferred tax assets, net$844.00 KCommon stock, $0.001 par value; 100,000 shares authorized; 35,081 and 34,848 shares issued and outstanding, respectively, at June 30, 2026; and 34,878 and 34,626 shares issued and outstanding, respectively, at December 31, 2025Common stock$35.00 KNoncontrolling interestNoncontrolling interest$45.24 MTreasury stock, at cost, 3 shares at June 30, 2026 and December 31, 2025Treasury stock−$65.00 K
Chart details

THE PENNANT GROUP, INC. (PNTG) FY2026 Q2 Balance Sheet

Balance sheet as of 2026-06-30. The chart shows assets, liabilities and equity at that date.

Assets
1,037,291,000 US dollars
Current assets
183,591,000 US dollars
Non-current assets
853,700,000 US dollars
Liabilities
632,849,000 US dollars
Current liabilities
152,406,000 US dollars
Non-current liabilities
480,443,000 US dollars
Equity
404,442,000 US dollars
Noncontrolling interest
45,239,000 US dollars. Included in consolidated equity; this amount is not added again.
Accounts receivable—less allowance for credit losses of $766 and $681, at June 30, 2026 and December 31, 2025, respectively
133,182,000 US dollars
Prepaid expenses and other current assets
35,136,000 US dollars
Cash
15,273,000 US dollars
Operating lease right-of-use assets
286,237,000 US dollars
Goodwill
235,789,000 US dollars
Other indefinite-lived intangibles
199,442,000 US dollars
Property and equipment, net
75,296,000 US dollars
Equity method investment
28,798,000 US dollars
Restricted and other assets
27,294,000 US dollars
Deferred tax assets, net
844,000 US dollars
Accrued wages and related liabilities
60,473,000 US dollars
Other accrued liabilities
34,141,000 US dollars
Operating lease liabilities—current
26,551,000 US dollars
Accounts payable
26,241,000 US dollars
Current maturities of long-term debt
5,000,000 US dollars
Long-term operating lease liabilities—less current portion
263,364,000 US dollars
Long-term debt
192,499,000 US dollars
Other long-term liabilities
22,776,000 US dollars
Deferred tax liabilities, net
1,804,000 US dollars
Additional paid-in capital
254,832,000 US dollars
Retained earnings
104,401,000 US dollars
Common stock, $0.001 par value; 100,000 shares authorized; 35,081 and 34,848 shares issued and outstanding, respectively, at June 30, 2026; and 34,878 and 34,626 shares issued and outstanding, respectively, at December 31, 2025
35,000 US dollars
Noncontrolling interest
45,239,000 US dollars
Treasury stock, at cost, 3 shares at June 30, 2026 and December 31, 2025
negative 65,000 US dollars
Gross equity (calculated)
404,507,000 US dollars. Net equity plus the magnitudes of its negative contributions equals gross positive equity. The negative contributions enter this reconciliation as add-backs; their filed signs stay negative.

Chart connections

  • Assets equal liabilities plus consolidated equity. Consolidated equity includes noncontrolling interests when reported.
  • Treasury shares and other negative equity contributions reduce equity.
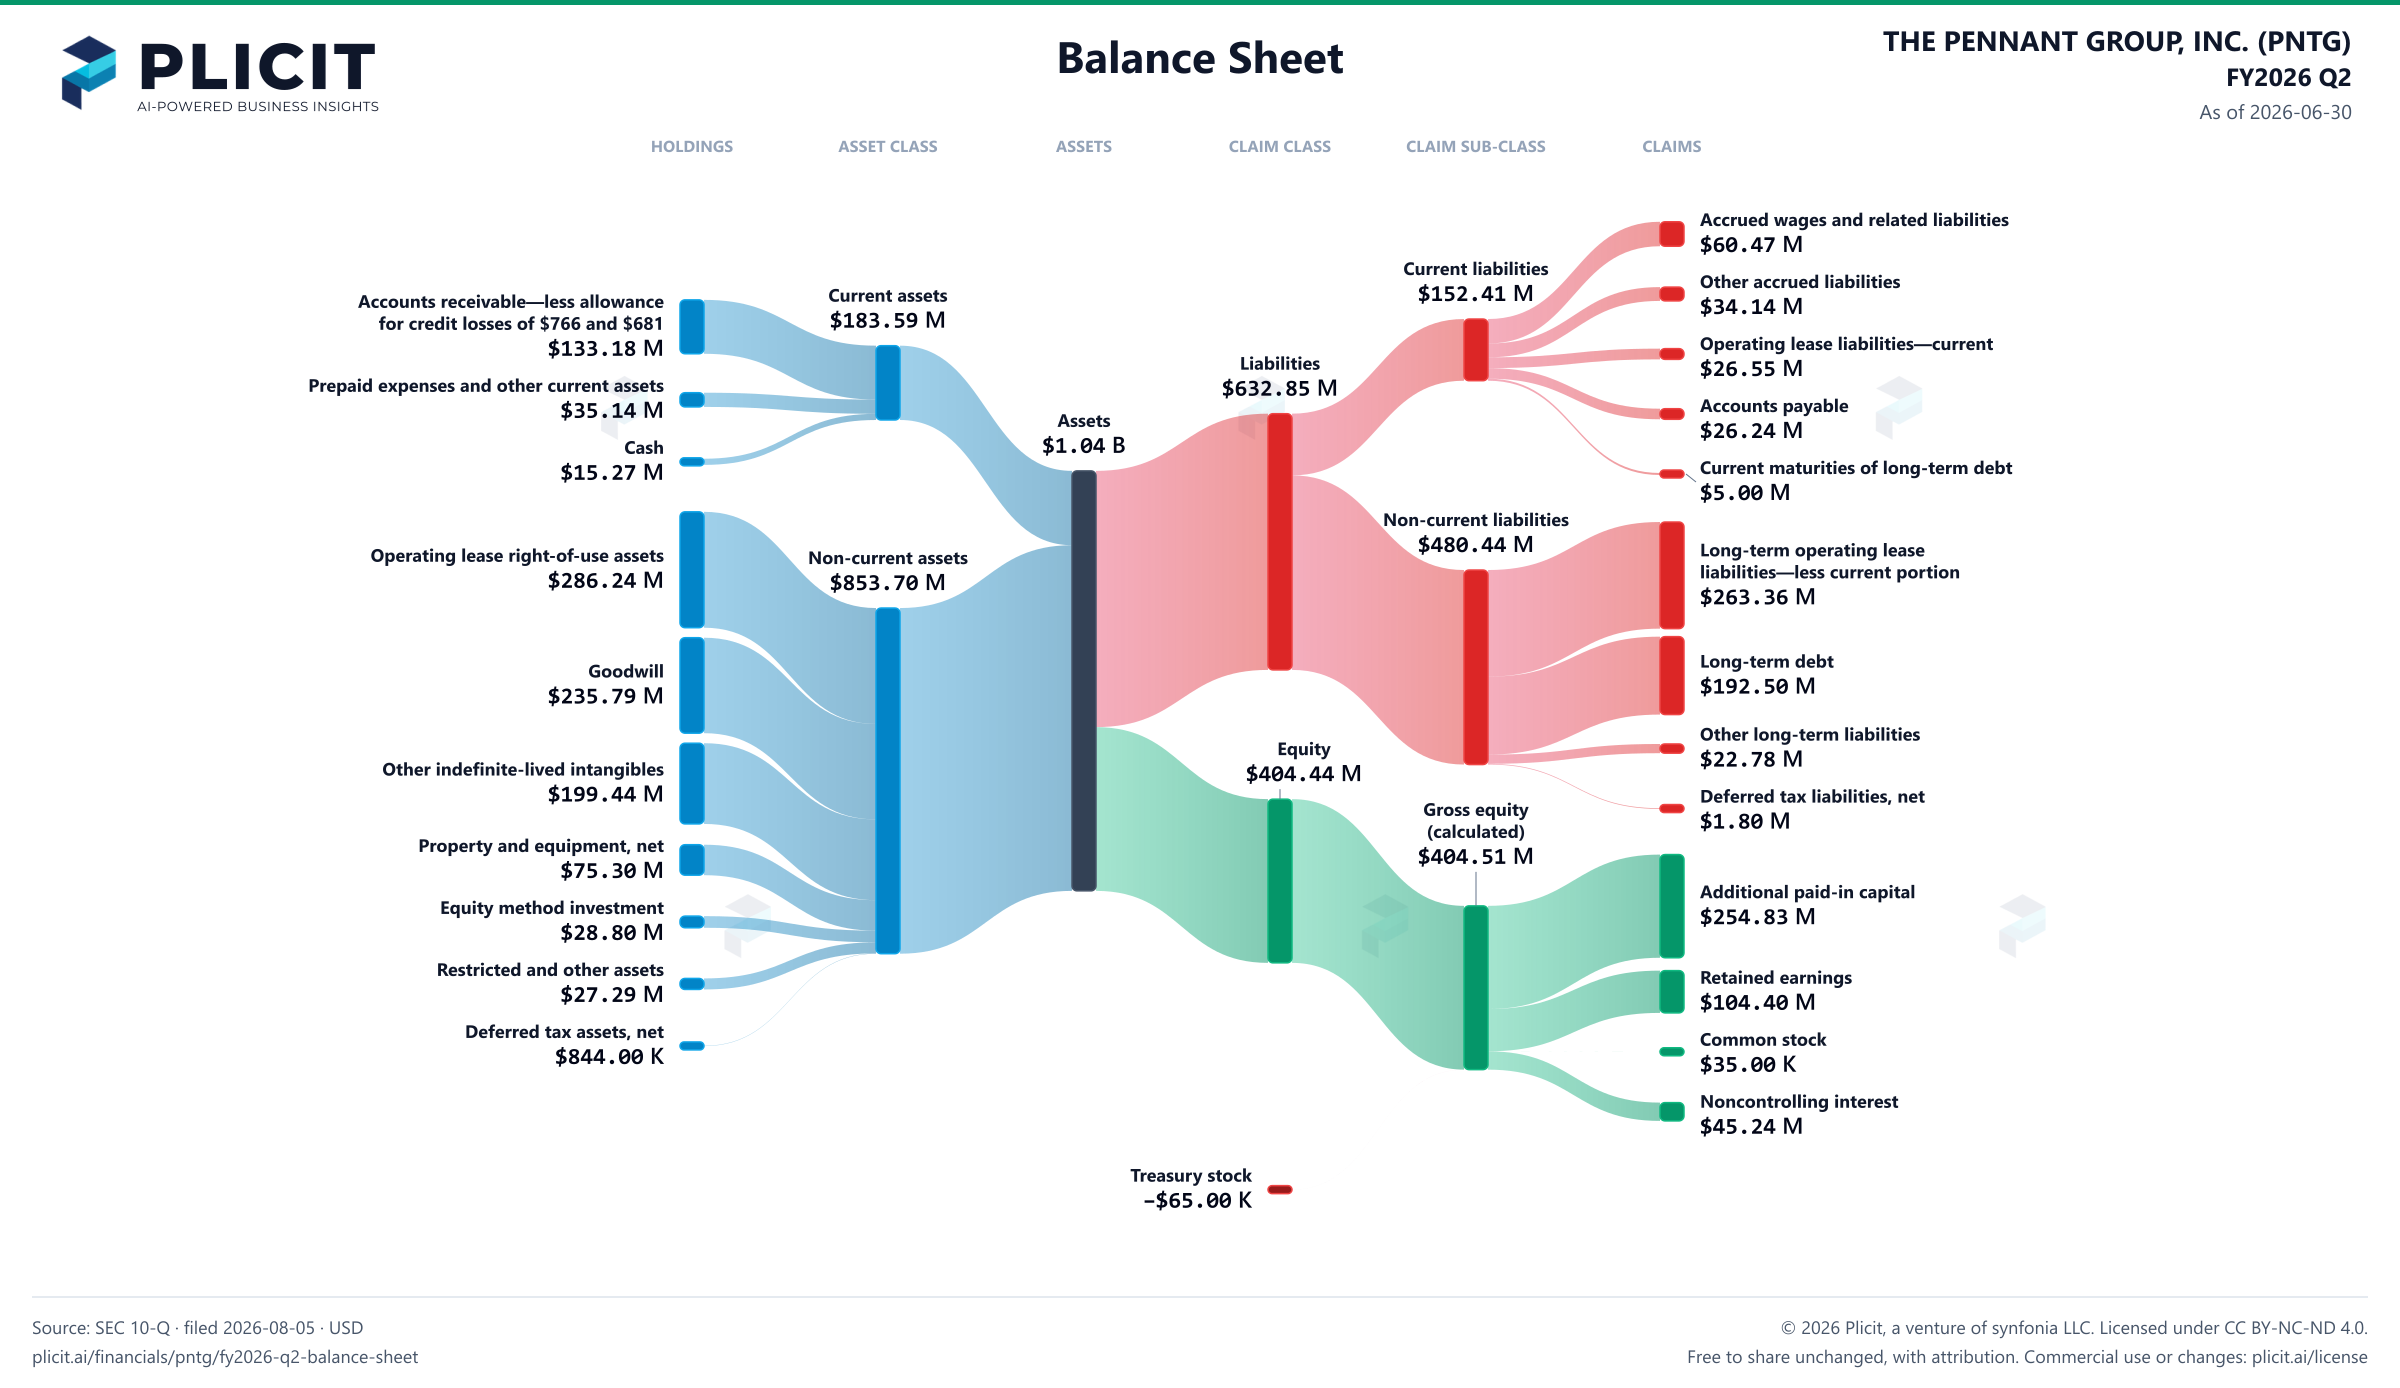
THE PENNANT GROUP, INC. (PNTG) FY2026 Q2 Balance Sheet Sankey chart
Free to share unchanged, with credit to Plicit.ai · CC BY-NC-ND 4.0Download PNG

Newsletter

Get the teardowns by email

Subscribe if you want the public-company teardowns in your inbox when they're released.

Product waitlist

Health Check and Teardown for your own company

A health check uncovers insights of your private books, not a public ticker. Join this list to get notified as soon as we go-live!