
PERDOCEO EDUCATION CORP (PRDO) FY2026 Q2 Balance Sheet
As of 2026-06-30
Balance Sheet
As of 2026-06-30
Swipe to see the full flow
Chart details
PERDOCEO EDUCATION CORP (PRDO) FY2026 Q2 Balance Sheet
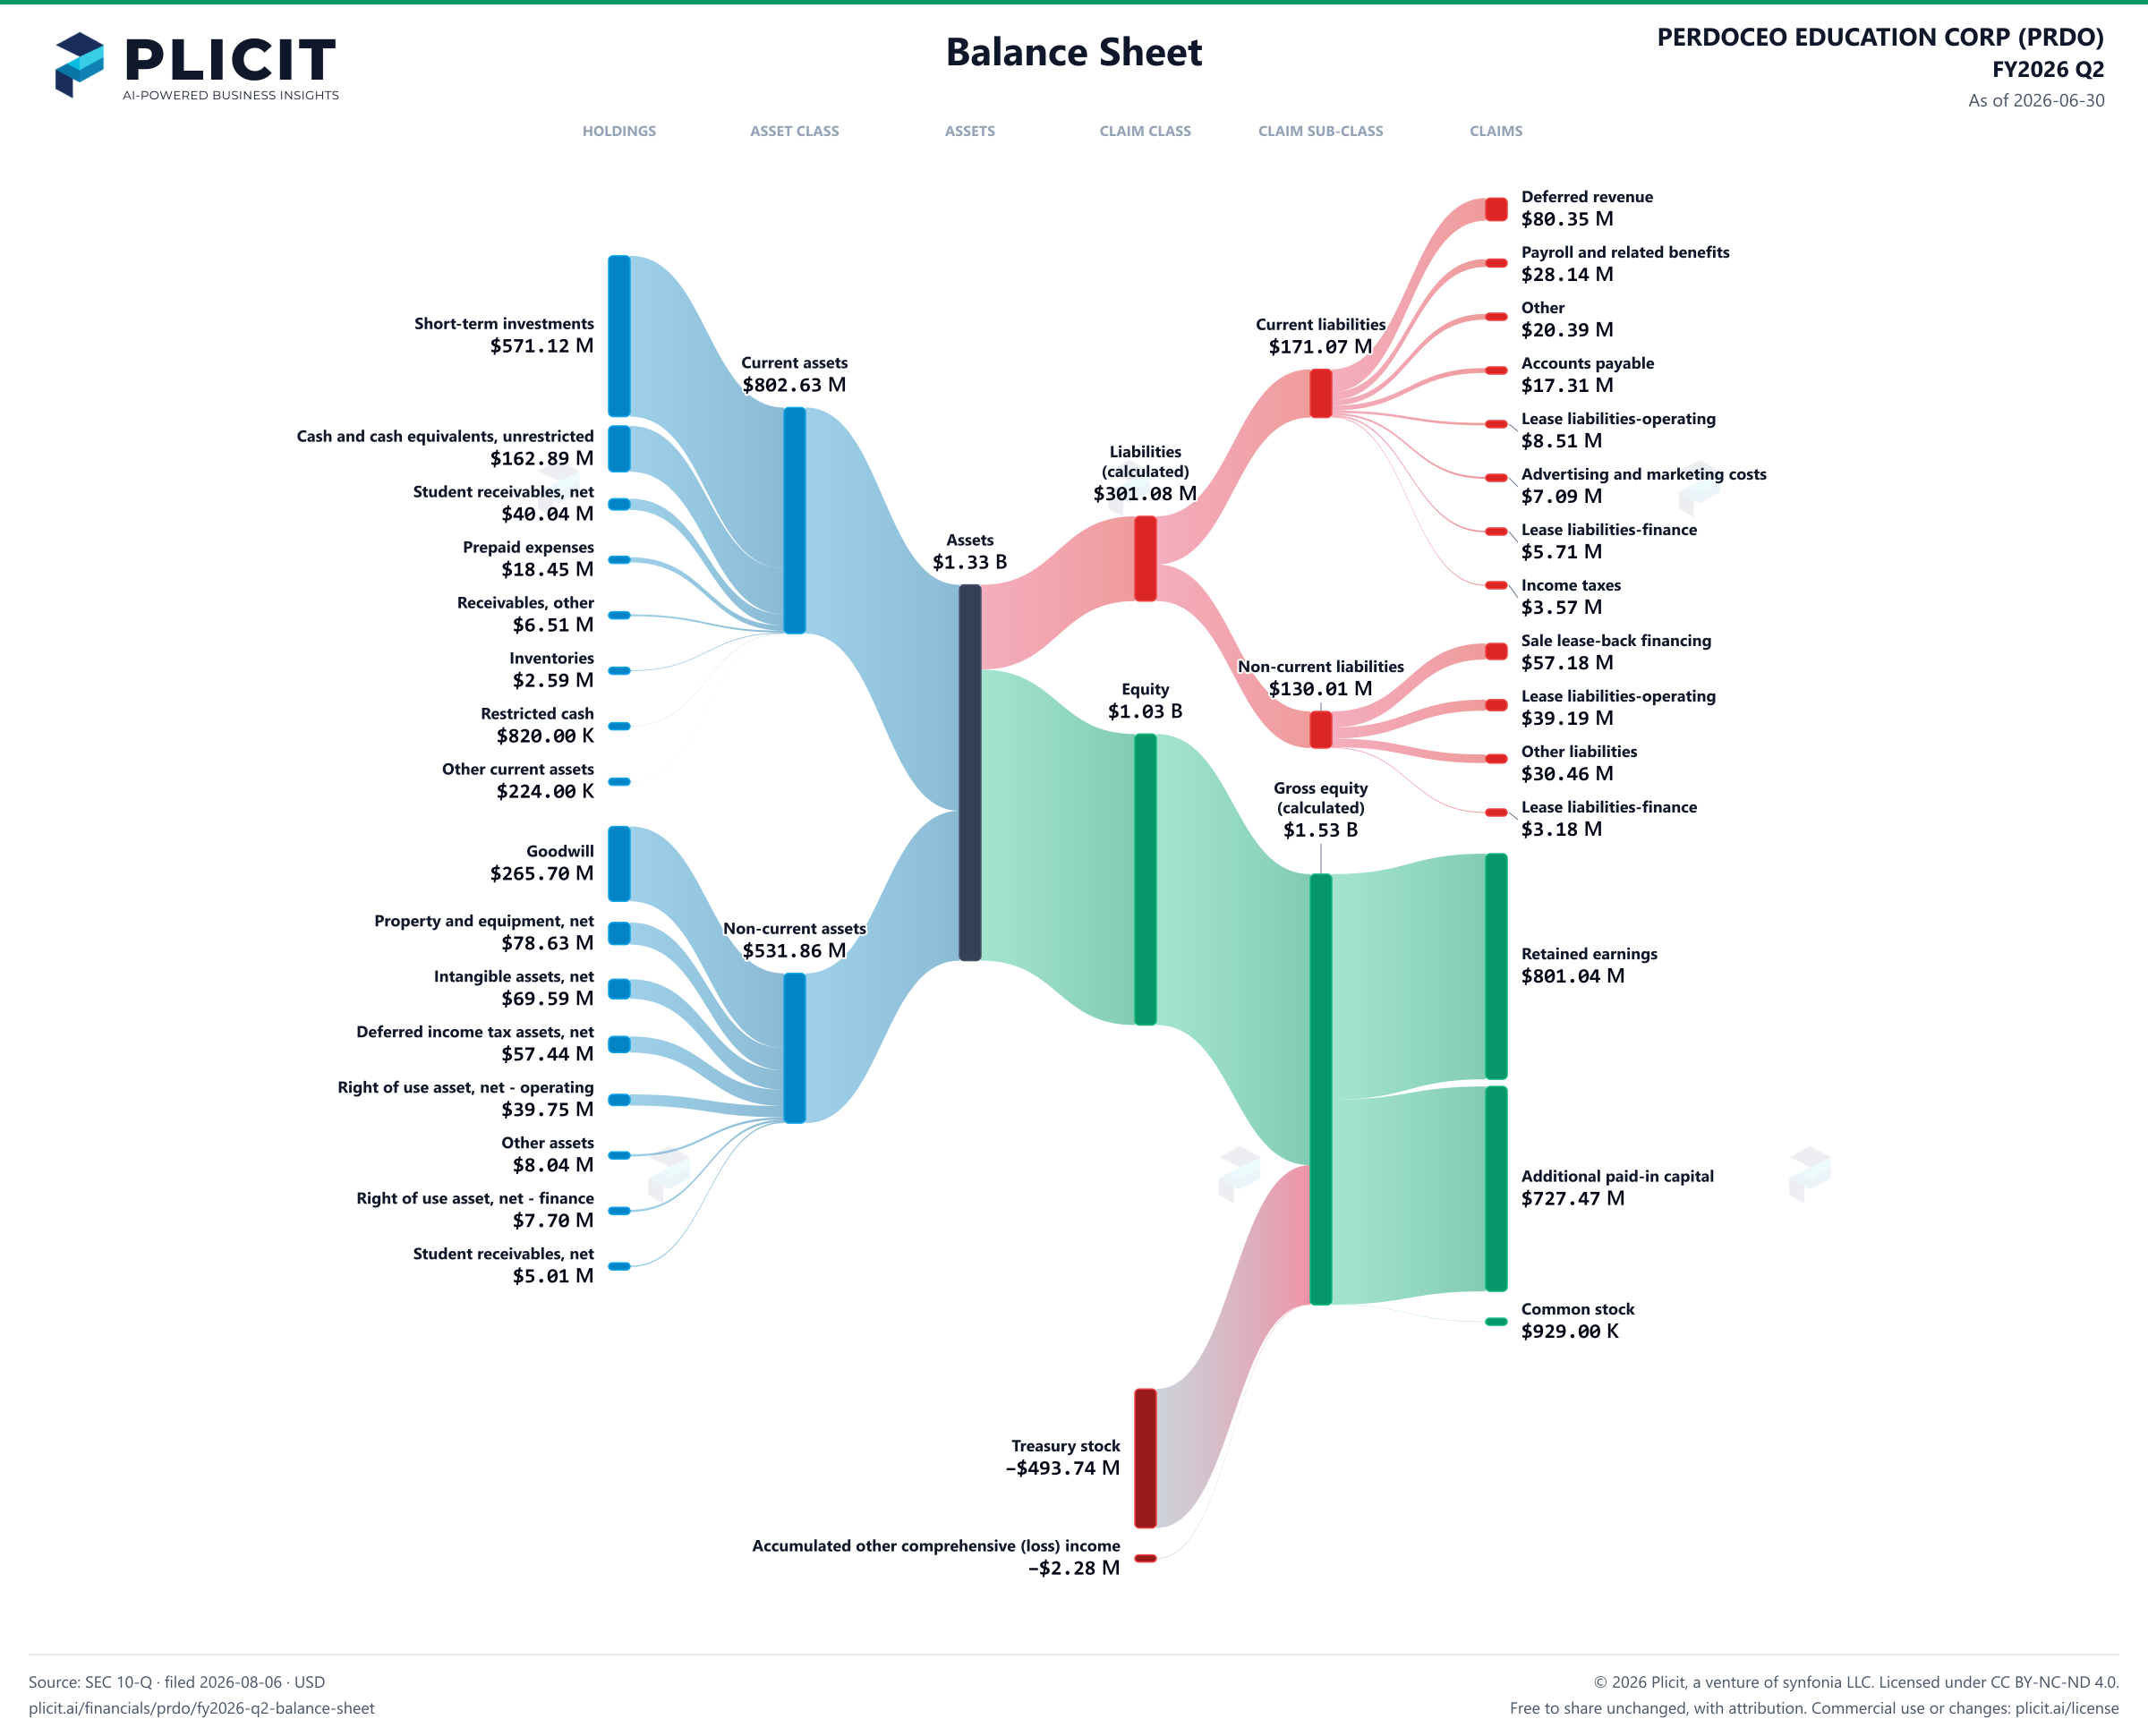
Balance sheet as of 2026-06-30. The chart shows assets, liabilities and equity at that date.
- Assets
- 1,334,491,000 US dollars
- Current assets
- 802,632,000 US dollars
- Non-current assets
- 531,859,000 US dollars
- Liabilities (calculated)
- 301,082,000 US dollars
- Current liabilities
- 171,074,000 US dollars
- Non-current liabilities
- 130,008,000 US dollars
- Equity
- 1,033,409,000 US dollars
- Student receivables, gross
- 76,360,000 US dollars. Part of Student receivables, net, drawn as one net amount.
- Allowance for credit losses
- negative 36,325,000 US dollars. Part of Student receivables, net, drawn as one net amount.
- Student receivables, gross
- 9,315,000 US dollars. Part of Student receivables, net, drawn as one net amount.
- Allowance for credit losses
- negative 4,307,000 US dollars. Part of Student receivables, net, drawn as one net amount.
- Short-term investments
- 571,115,000 US dollars
- Cash and cash equivalents, unrestricted
- 162,889,000 US dollars
- Student receivables, net
- 40,035,000 US dollars
- Prepaid expenses
- 18,450,000 US dollars
- Receivables, other
- 6,513,000 US dollars
- Inventories
- 2,586,000 US dollars
- Restricted cash
- 820,000 US dollars
- Other current assets
- 224,000 US dollars
- Goodwill
- 265,697,000 US dollars
- Property and equipment, net of accumulated depreciation of $94,689 and $86,908 as of June 30, 2026 and December 31, 2025, respectively
- 78,632,000 US dollars
- Intangible assets, net of amortization of $53,137 and $44,786 as of June 30, 2026 and December 31,2025, respectively
- 69,594,000 US dollars
- Deferred income tax assets, net
- 57,438,000 US dollars
- Right of use asset, net - operating
- 39,745,000 US dollars
- Other assets
- 8,044,000 US dollars
- Right of use asset, net - finance
- 7,701,000 US dollars
- Student receivables, net
- 5,008,000 US dollars
- Deferred revenue
- 80,354,000 US dollars
- Payroll and related benefits
- 28,144,000 US dollars
- Other
- 20,391,000 US dollars
- Accounts payable
- 17,310,000 US dollars
- Lease liabilities-operating
- 8,514,000 US dollars
- Advertising and marketing costs
- 7,085,000 US dollars
- Lease liabilities-finance
- 5,711,000 US dollars
- Income taxes
- 3,565,000 US dollars
- Sale lease-back financing
- 57,178,000 US dollars
- Lease liabilities-operating
- 39,194,000 US dollars
- Other liabilities
- 30,460,000 US dollars
- Lease liabilities-finance
- 3,176,000 US dollars
- Retained earnings
- 801,038,000 US dollars
- Additional paid-in capital
- 727,470,000 US dollars
- Common stock, $0.01 par value; 300,000,000 shares authorized; 92,899,239 and 92,072,703 shares issued, 62,577,055 and 62,478,373 shares outstanding as of June 30, 2026 and December 31, 2025, respectively
- 929,000 US dollars
- Treasury stock, at cost; 30,322,184 and 29,594,330 shares as of June 30, 2026 and December 31, 2025, respectively
- negative 493,744,000 US dollars
- Accumulated other comprehensive (loss) income
- negative 2,284,000 US dollars
- Gross equity (calculated)
- 1,529,437,000 US dollars. Net equity plus the magnitudes of its negative contributions equals gross positive equity. The negative contributions enter this reconciliation as add-backs; their filed signs stay negative.
Chart connections
- Assets equal liabilities plus consolidated equity. Consolidated equity includes noncontrolling interests when reported.
- Treasury shares and other negative equity contributions reduce equity.
Free to share unchanged, with credit to Plicit.ai · CC BY-NC-ND 4.0Download PNG
Product waitlist
Health Check and Teardown for your own company
A health check uncovers insights of your private books, not a public ticker. Join this list to get notified as soon as we go-live!