
Perrigo Company plc (PRGO) FY2026 Q2 P&L / Income Statement

Published · Updated Source: Form 10-Q on SEC EDGAR filed (opens in a new tab)

Key Takeaways

  • Specialty Care's operating income fell $18.50 M from a year earlier, to $47.80 M.
  • Self Care brought in 56% of sales, but its operating income slid to $78.70 M from $93.90 M.
  • Infant Formula swung to a $4.00 M operating profit from a $12.20 M loss, on 23% sales growth.
  • Head-office costs and other items took about 82% of what the businesses earned.

The Unvarnished Truth

Specialty Care profit fell $18.50 M as Perrigo's segments lost ground

Perrigo's three businesses earned $130.50 M of operating income this quarter, down from $148.00 M a year earlier, and Specialty Care took the biggest hit. Its operating income fell $18.50 M to $47.80 M. Management blames "unfavorable gross profit flow through" from prior-year manufacturing volume headwinds and unfavorable mix, plus $4.0 million more spent on advertising to support second half growth initiatives. Self Care, which brings in 56% of sales, also slipped, to $78.70 M from $93.90 M. Only Infant Formula improved, swinging to a $4.00 M profit.

Why is Self Care slipping? Management cites "unfavorable net pricing impacts and lower consumption across both the U.S. and Europe", partly from a weaker cough and cold season that left retailers holding less inventory. Its sales fell 3.7% from a year earlier, gentler than the 12% drop of the quarter before. Infant Formula sales jumped 23%, but management credits mainly the "timing of contract infant formula shipments". Timing gains can reverse in a later quarter. And All Other lost $24.10 M of sales, largely because it held the Dermacosmetics business sold in April 2026.

For investors, mix matters: Specialty Care keeps about 21% of its sales as operating income and Infant Formula about 4.0%, so formula's growth does little for profit. The businesses' combined margin fell to 14.4% from 16.2%. In Self Care, management points to "benefits from the Operational Enhancement Program" cutting operating expenses by $12.0 million, yet head-office costs and other items still took about 82% of segment profit. Watch Self Care pricing and whether extra advertising lifts Specialty Care. If that advertising push fails, where does Perrigo's profit growth come from?
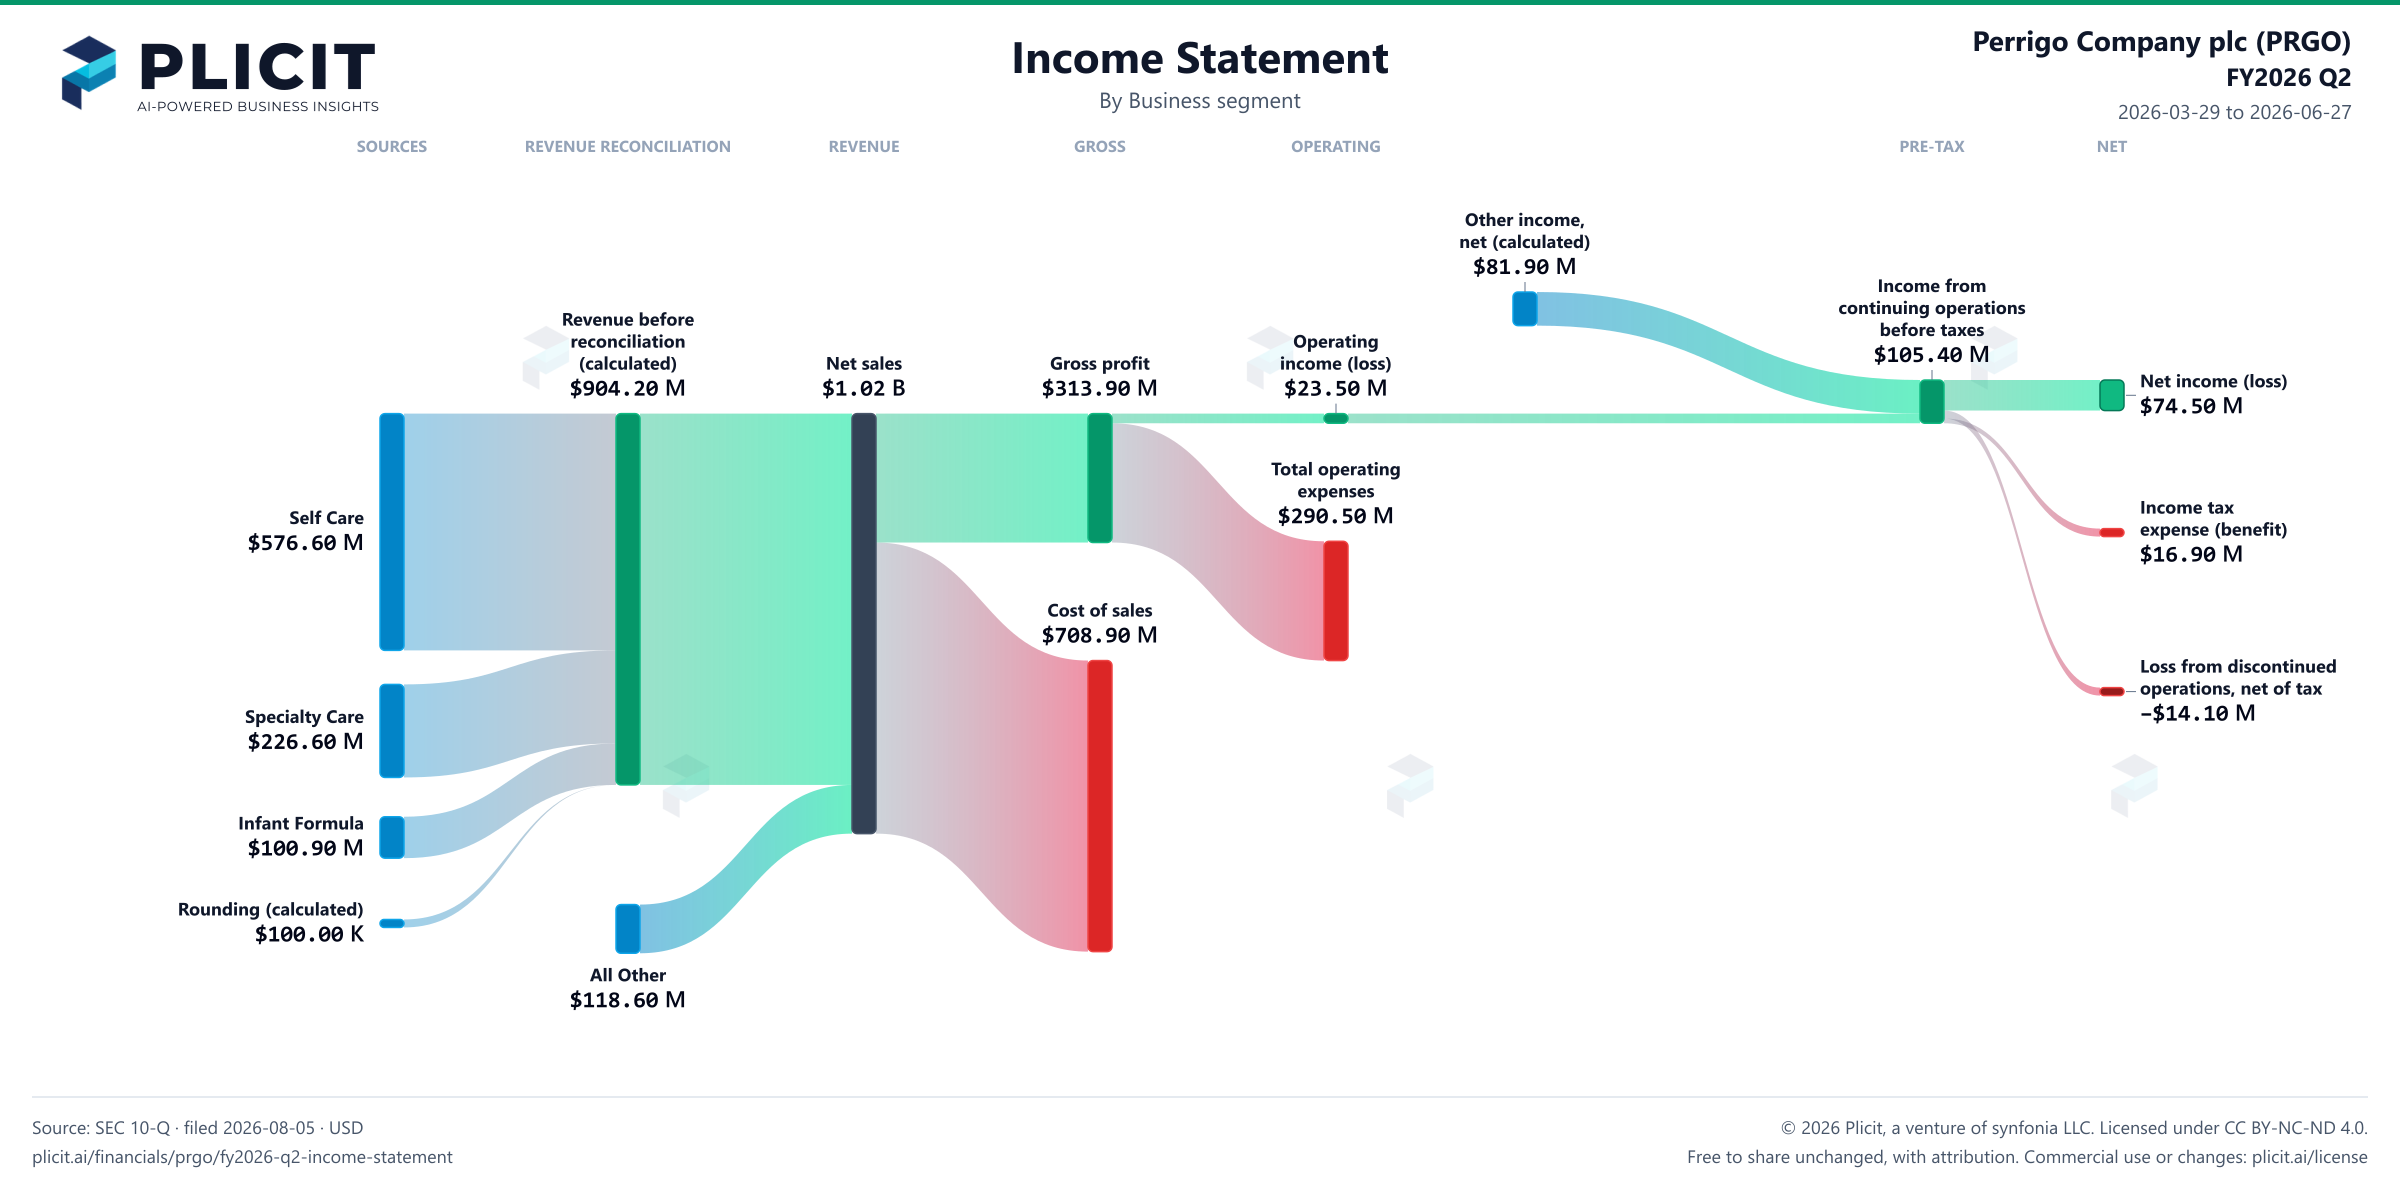
Revenue by Business Segment

Swipe to see the full flow
Perrigo Company plc (PRGO) FY2026 Q2 P&L / Income StatementIncome statement for 2026-03-29 through 2026-06-27. View: Business segment. Revenue uses this breakdown; costs and expenses retain the consolidated categories.SOURCESREVENUE RECONCILIATIONREVENUEGROSSOPERATINGPRE-TAXNETSelf CareSpecialty CareInfant FormulaRounding (calculated)Net salesRevenue before reconciliation (calculated)All OtherGross profitCost of salesOperating income (loss)Total operating expensesOther income (expense), net (calculated)Income from continuing operations before taxesNet income (loss)Income tax expense (benefit)Loss from discontinued operations, net of taxOther income (expense), net (calculated)Other income,net (calculated)$81.90 MIncome from continuing operations before taxesIncome fromcontinuing operationsbefore taxes$105.40 MRevenue before reconciliation (calculated)Revenue beforereconciliation(calculated)$904.20 MOperating income (loss)Operatingincome (loss)$23.50 MNet salesNet sales$1.02 BGross profitGross profit$313.90 MNet income (loss)Net income (loss)$74.50 MTotal operating expensesTotal operatingexpenses$290.50 MIncome tax expense (benefit)Income taxexpense (benefit)$16.90 MSelf CareSelf Care$576.60 MCost of salesCost of sales$708.90 MLoss from discontinued operations, net of taxLoss from discontinuedoperations, net of tax−$14.10 MSpecialty CareSpecialty Care$226.60 MInfant FormulaInfant Formula$100.90 MRounding (calculated)Rounding (calculated)$100.00 KAll OtherAll Other$118.60 M
Chart details

Perrigo Company plc (PRGO) FY2026 Q2 P&L / Income Statement

Income statement for 2026-03-29 through 2026-06-27. View: Business segment. Revenue uses this breakdown; costs and expenses retain the consolidated categories.

Net sales
1,022,800,000 US dollars
Cost of sales
708,900,000 US dollars
Gross profit
313,900,000 US dollars
Total operating expenses
290,500,000 US dollars
Operating income (loss)
23,500,000 US dollars
Other income (expense), net (calculated)
81,900,000 US dollars
Income from continuing operations before taxes
105,400,000 US dollars
Income tax expense (benefit)
16,900,000 US dollars
Net income (loss)
74,500,000 US dollars
Self Care
576,600,000 US dollars
Specialty Care
226,600,000 US dollars
Infant Formula
100,900,000 US dollars
Rounding (calculated)
100,000 US dollars
Impairment charges
1,000,000 US dollars. Source detail retained; this breakdown has not reconciled exactly and is not drawn.
Other operating expense, net
0 US dollars. Source detail retained; this breakdown has not reconciled exactly and is not drawn.
Research and development
23,700,000 US dollars. Source detail retained; this breakdown has not reconciled exactly and is not drawn.
Distribution
21,700,000 US dollars. Source detail retained; this breakdown has not reconciled exactly and is not drawn.
Restructuring
14,400,000 US dollars. Source detail retained; this breakdown has not reconciled exactly and is not drawn.
Administration
100,000,000 US dollars. Source detail retained; this breakdown has not reconciled exactly and is not drawn.
Selling
129,500,000 US dollars. Source detail retained; this breakdown has not reconciled exactly and is not drawn.
Revenue before reconciliation (calculated)
904,200,000 US dollars. Sum of the reported revenue categories before the separately reported reconciliation.
All Other
118,600,000 US dollars. Reported reconciliation to consolidated revenue.
Loss from discontinued operations, net of tax
negative 14,100,000 US dollars. Reported below-tax contribution to net income.

Chart connections

  • Revenue less cost of revenue equals gross profit; gross profit less operating expenses equals operating income.
  • Operating income plus other income or expense equals income before tax. Income before tax less income tax expense or benefit, plus the explicitly reported below-tax contributions, equals net income.
  • Reported revenue categories plus the separately reported signed reconciliation equals consolidated revenue.
  • The amounts that make up operating profit come to $23.40 M and operating profit is $23.50 M; the $0.10 M difference is within the rounding of the filed amounts.
  • The amounts that make up net income come to $74.40 M and net income is $74.50 M; the $0.10 M difference is within the rounding of the filed amounts.
Perrigo Company plc (PRGO) FY2026 Q2 Revenue by Business Segment Sankey chart
Free to share unchanged, with credit to Plicit.ai · CC BY-NC-ND 4.0Download PNG

Intelligent Insights for Investors

Which of Perrigo's businesses drove its profit change over the past year?

Specialty Care, above all: its operating income fell $18.50 M from a year earlier, more than the $17.50 M drop in its businesses' combined operating profit. Infant Formula moved the other way, swinging to a $4.00 M profit.

How profitable is each of Perrigo's businesses?

Specialty Care is the richest, keeping about 21% of sales as operating income this quarter, while Infant Formula kept just 4.0%. Self Care sits between, at 13.6%.

Intelligent Insights for Employees

Which of Perrigo's businesses brings in the most sales?

Self Care: it brought in 56% of Perrigo's sales this quarter, against 22% for Specialty Care, the next largest.

Product waitlist

Health Check and Teardown for your own company

A health check uncovers insights of your private books, not a public ticker. Join this list to get notified as soon as we go-live!