
Primerica, Inc. (PRI) FY2026 Q2 Balance Sheet

Balance Sheet

As of 2026-06-30

Swipe to see the full flow
Primerica, Inc. (PRI) FY2026 Q2 Balance SheetBalance sheet as of 2026-06-30. The chart shows assets, liabilities and equity at that date.Liabilities$12.26 BAssets$14.78 BEquity$2.52 BGross equity(calculated)$2.66 BHOLDINGSASSETSCLAIM CLASSCLAIM SUB-CLASSCLAIMSDeferred policy acquisition costs, netFixed-maturity securities available-for-sale, at fair value (amortized cost: $3,611,960 in 2026 and $3,378,618 in 2025)Reinsurance recoverablesSeparate account assetsFixed-maturity security held-to-maturity, at amortized cost (fair value: $1,036,619 in 2026 and $1,153,047 in 2025)Cash and cash equivalentsAgent balances, due premiums and other receivablesOther assetsIncome taxesPolicy loans and other invested assetsIntangible assetOperating lease right-of-use assetsAccrued investment incomeTrading securities, at fair value (cost: $32,813 in 2026 and $13,084 in 2025)Equity securities, at fair value (historical cost: $20,624 in 2026 and $20,501 in 2025)Short-term investments available-for-sale, at fair value (amortized cost: $4,953 in 2026)Future policy benefitsSeparate account liabilitiesSurplus noteOther liabilitiesNote payablePolicy claims and other benefits payableOther policyholders’ fundsPayable under securities lendingOperating lease liabilitiesIncome taxesUnearned and advance premiumsRetained earningsEffect of change in discount rate assumptions on the liability for future policy benefitsCommon stock ($0.01 par value; authorized 500,000 shares in 2026 and 2025; issued and outstanding 30,898 shares in 2026 and 31,810 shares in 2025)AssetsLiabilitiesEquityGross equity (calculated)Net unrealized investment gains (losses) on available-for-sale securitiesUnrealized foreign currency translation gains (losses)Deferred policy acquisition costs, netDeferred policy acquisition costs, net$3.99 BFuture policy benefitsFuture policy benefits$6.80 BFixed-maturity securities available-for-sale, at fair value (amortized cost: $3,611,960 in 2026 and $3,378,618 in 2025)Fixed-maturity securitiesavailable-for-sale, at fair value$3.47 BLiabilitiesLiabilities$12.26 BReinsurance recoverablesReinsurance recoverables$2.45 BSeparate account liabilitiesSeparate account liabilities$2.16 BAssetsAssets$14.78 BSurplus noteSurplus note$1.07 BSeparate account assetsSeparate account assets$2.16 BOther liabilitiesOther liabilities$619.81 MFixed-maturity security held-to-maturity, at amortized cost (fair value: $1,036,619 in 2026 and $1,153,047 in 2025)Fixed-maturity securityheld-to-maturity, at amortized cost$1.07 BNote payableNote payable$595.72 MCash and cash equivalentsCash and cash equivalents$600.18 MPolicy claims and other benefits payablePolicy claims and other benefits payable$489.11 MAgent balances, due premiums and other receivablesAgent balances, due premiums and other receivables$291.44 MOther policyholders’ fundsOther policyholders’ funds$344.44 MOther assetsOther assets$259.73 MPayable under securities lendingPayable under securities lending$88.58 MIncome taxesIncome taxes$181.03 MOperating lease liabilitiesOperating lease liabilities$46.85 MPolicy loans and other invested assetsPolicy loans and other invested assets$120.74 MEquityEquity$2.52 BIncome taxesIncome taxes$24.91 MIntangible assetIntangible asset$45.28 MUnearned and advance premiumsUnearned and advance premiums$16.42 MOperating lease right-of-use assetsOperating lease right-of-use assets$39.70 MGross equity (calculated)Gross equity(calculated)$2.66 BRetained earningsRetained earnings$2.47 BAccrued investment incomeAccrued investment income$33.33 MEffect of change in discount rate assumptions on the liability for future policy benefitsEffect of change in discount rate assumptionson the liability for future policy benefits$190.80 MTrading securities, at fair value (cost: $32,813 in 2026 and $13,084 in 2025)Trading securities, at fair value$32.38 MEquity securities, at fair value (historical cost: $20,624 in 2026 and $20,501 in 2025)Equity securities, at fair value$29.27 MCommon stock ($0.01 par value; authorized 500,000 shares in 2026 and 2025; issued and outstanding 30,898 shares in 2026 and 31,810 shares in 2025)Common stock$309.00 KShort-term investments available-for-sale, at fair value (amortized cost: $4,953 in 2026)Short-term investments available-for-sale, at fair value$4.95 MNet unrealized investment gains (losses) on available-for-sale securitiesNet unrealized investment gains(losses) on available-for-sale securities−$110.64 MUnrealized foreign currency translation gains (losses)Unrealized foreign currency translation gains (losses)−$30.95 M
Chart details

Primerica, Inc. (PRI) FY2026 Q2 Balance Sheet

Balance sheet as of 2026-06-30. The chart shows assets, liabilities and equity at that date.

Assets
14,781,939,000 US dollars
Liabilities
12,258,985,000 US dollars
Equity
2,522,954,000 US dollars
Deferred policy acquisition costs, net
3,991,486,000 US dollars
Fixed-maturity securities available-for-sale, at fair value (amortized cost: $3,611,960 in 2026 and $3,378,618 in 2025)
3,471,682,000 US dollars
Reinsurance recoverables
2,450,745,000 US dollars
Separate account assets
2,156,498,000 US dollars
Fixed-maturity security held-to-maturity, at amortized cost (fair value: $1,036,619 in 2026 and $1,153,047 in 2025)
1,073,520,000 US dollars
Cash and cash equivalents
600,183,000 US dollars
Agent balances, due premiums and other receivables
291,440,000 US dollars
Other assets
259,728,000 US dollars
Income taxes
181,028,000 US dollars
Policy loans and other invested assets
120,736,000 US dollars
Intangible asset
45,275,000 US dollars
Operating lease right-of-use assets
39,697,000 US dollars
Accrued investment income
33,330,000 US dollars
Trading securities, at fair value (cost: $32,813 in 2026 and $13,084 in 2025)
32,376,000 US dollars
Equity securities, at fair value (historical cost: $20,624 in 2026 and $20,501 in 2025)
29,265,000 US dollars
Short-term investments available-for-sale, at fair value (amortized cost: $4,953 in 2026)
4,950,000 US dollars
Future policy benefits
6,803,364,000 US dollars
Separate account liabilities
2,156,498,000 US dollars
Surplus note
1,073,291,000 US dollars
Other liabilities
619,810,000 US dollars
Note payable
595,716,000 US dollars
Policy claims and other benefits payable
489,108,000 US dollars
Other policyholders’ funds
344,437,000 US dollars
Payable under securities lending
88,579,000 US dollars
Operating lease liabilities
46,852,000 US dollars
Income taxes
24,907,000 US dollars
Unearned and advance premiums
16,423,000 US dollars
Retained earnings
2,473,436,000 US dollars
Effect of change in discount rate assumptions on the liability for future policy benefits
190,796,000 US dollars
Common stock ($0.01 par value; authorized 500,000 shares in 2026 and 2025; issued and outstanding 30,898 shares in 2026 and 31,810 shares in 2025)
309,000 US dollars
Net unrealized investment gains (losses) on available-for-sale securities
negative 110,635,000 US dollars
Unrealized foreign currency translation gains (losses)
negative 30,952,000 US dollars
Gross equity (calculated)
2,664,541,000 US dollars. Net equity plus the magnitudes of its negative contributions equals gross positive equity. The negative contributions enter this reconciliation as add-backs; their filed signs stay negative.

Chart connections

  • Assets equal liabilities plus consolidated equity. Consolidated equity includes noncontrolling interests when reported.
  • Treasury shares and other negative equity contributions reduce equity.
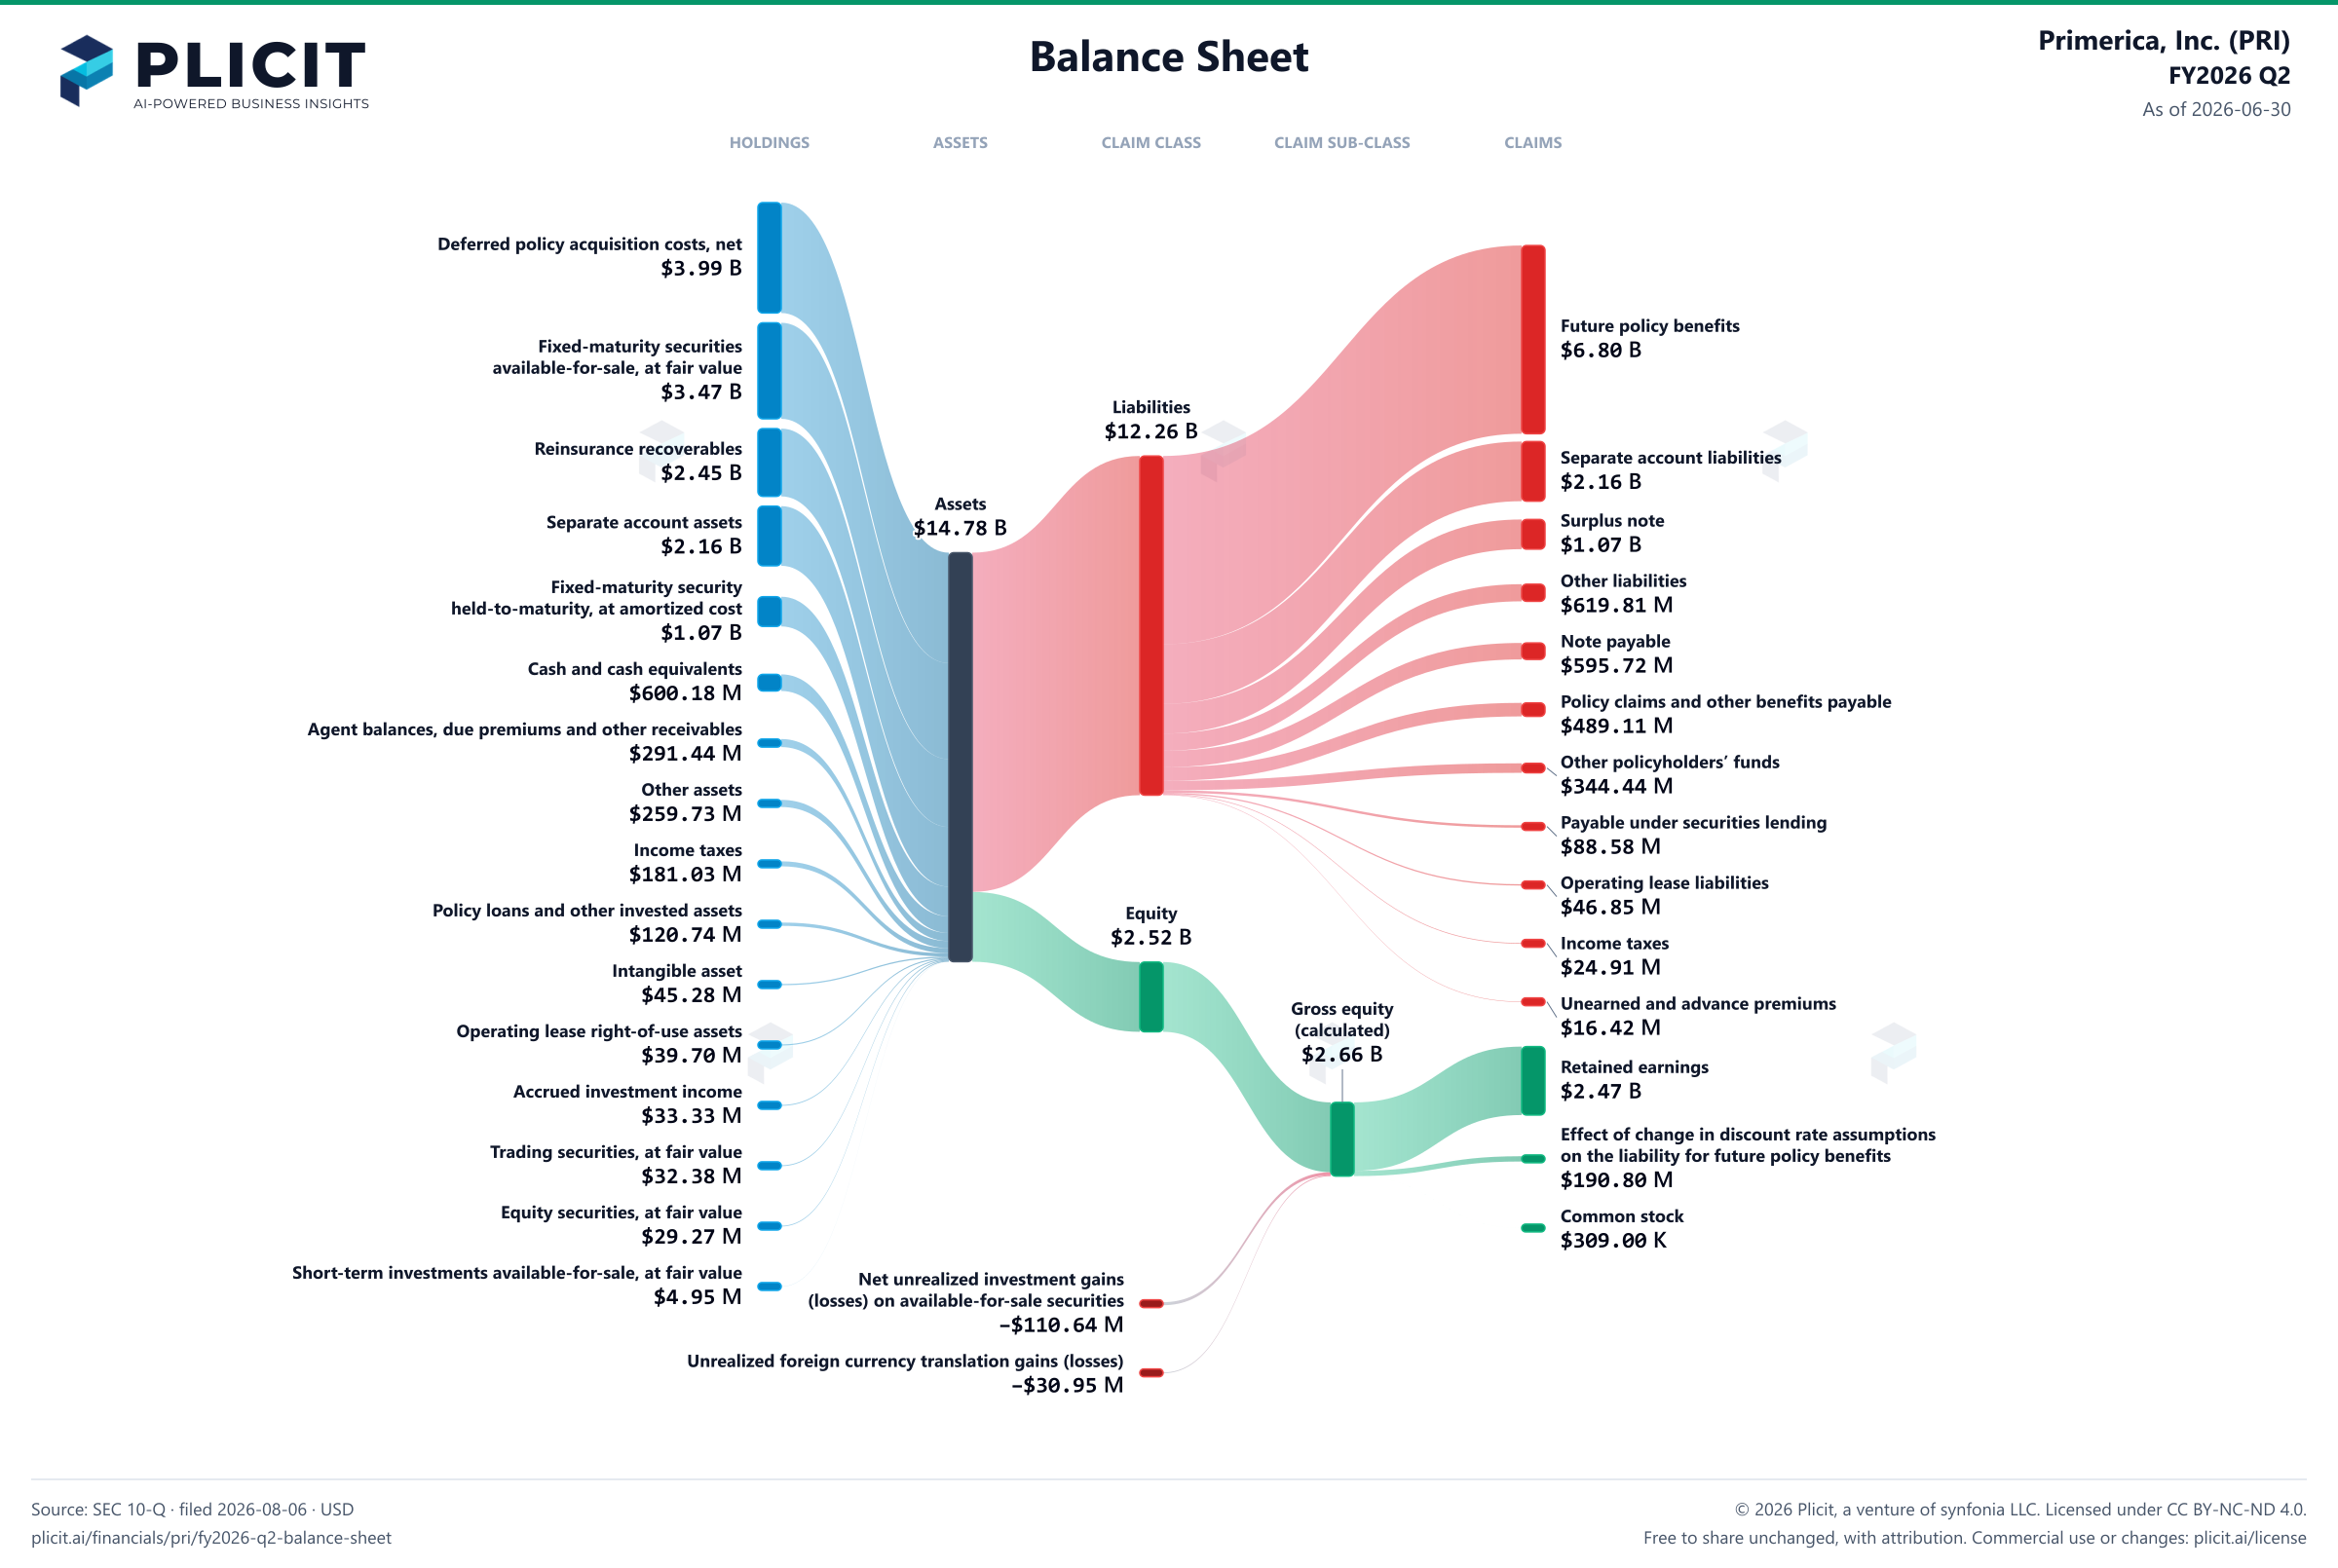
Primerica, Inc. (PRI) FY2026 Q2 Balance Sheet Sankey chart
Free to share unchanged, with credit to Plicit.ai · CC BY-NC-ND 4.0Download PNG

Newsletter

Get the teardowns by email

Subscribe if you want the public-company teardowns in your inbox when they're released.

Product waitlist

Health Check and Teardown for your own company

A health check uncovers insights of your private books, not a public ticker. Join this list to get notified as soon as we go-live!