
POWER SOLUTIONS INTERNATIONAL, INC. (PSIX) FY2026 Q2 P&L / Income Statement

Revenue by Geography

2026-04-01 to 2026-06-30

Swipe to see the full flow
POWER SOLUTIONS INTERNATIONAL, INC. (PSIX) FY2026 Q2 P&L / Income StatementIncome statement for 2026-04-01 through 2026-06-30. View: Geography. Revenue uses this breakdown; costs and expenses retain the consolidated categories.SOURCESREVENUEGROSSOPERATINGPRE-TAXNETUNITED STATESNorth America (outside of United States)Pacific RimEuropeOtherNet sales (to related parties $10 and $402 for the three months ended June 30, 2026 and 2025, respectively, $19 and $865 for the six months ended June 30, 2026 and 2025, respectively)Gross profitCost of sales (derived from related party net sales $3 and $271 for the three months ended June 30, 2026 and 2025, respectively, and $8 and $587 for the six months ended June 30, 2026 and 2025, respectively)Operating incomeTotal operating expensesSelling, general and administrative expensesResearch and development expensesAmortization of intangible assetsIncome before income taxesTotal other expense, netNet incomeIncome tax expense (benefit)Net sales (to related parties $10 and $402 for the three months ended June 30, 2026 and 2025, respectively, $19 and $865 for the six months ended June 30, 2026 and 2025, respectively)Net sales$152.54 MGross profitGross profit$41.37 MOperating incomeOperating income$23.92 MIncome before income taxesPretax income$22.47 MNet incomeNet income$16.86 MTotal operating expensesTotal operatingexpenses$17.45 MIncome tax expense (benefit)Income taxexpense (benefit)$5.61 MCost of sales (derived from related party net sales $3 and $271 for the three months ended June 30, 2026 and 2025, respectively, and $8 and $587 for the six months ended June 30, 2026 and 2025, respectively)Cost of sales$111.18 MUNITED STATESUNITED STATES$142.96 MSelling, general and administrative expensesSelling, general andadministrative expenses$12.12 MTotal other expense, netTotal otherexpense, net−$1.45 MResearch and development expensesResearch anddevelopment expenses$5.05 MAmortization of intangible assetsAmortization of intangible assets$280.00 KNorth America (outside of United States)North America (outsideof United States)$4.90 MPacific RimPacific Rim$3.19 MEuropeEurope$1.37 MOtherOther$123.00 K
Chart details

POWER SOLUTIONS INTERNATIONAL, INC. (PSIX) FY2026 Q2 P&L / Income Statement

Income statement for 2026-04-01 through 2026-06-30. View: Geography. Revenue uses this breakdown; costs and expenses retain the consolidated categories.

Net sales (to related parties $10 and $402 for the three months ended June 30, 2026 and 2025, respectively, $19 and $865 for the six months ended June 30, 2026 and 2025, respectively)
152,544,000 US dollars
Cost of sales (derived from related party net sales $3 and $271 for the three months ended June 30, 2026 and 2025, respectively, and $8 and $587 for the six months ended June 30, 2026 and 2025, respectively)
111,176,000 US dollars
Gross profit
41,368,000 US dollars
Total operating expenses
17,448,000 US dollars
Operating income
23,920,000 US dollars
Total other expense, net
negative 1,448,000 US dollars
Income before income taxes
22,472,000 US dollars
Income tax expense (benefit)
5,611,000 US dollars
Net income
16,861,000 US dollars
UNITED STATES
142,962,000 US dollars
North America (outside of United States)
4,904,000 US dollars
Pacific Rim
3,190,000 US dollars
Europe
1,365,000 US dollars
Other
123,000 US dollars
Research and development expenses
5,051,000 US dollars
Selling, general and administrative expenses
12,117,000 US dollars
Amortization of intangible assets
280,000 US dollars

Chart connections

  • Revenue less cost of revenue equals gross profit; gross profit less operating expenses equals operating income.
  • Operating income plus other income or expense equals income before tax. Income before tax less income tax expense or benefit equals net income.
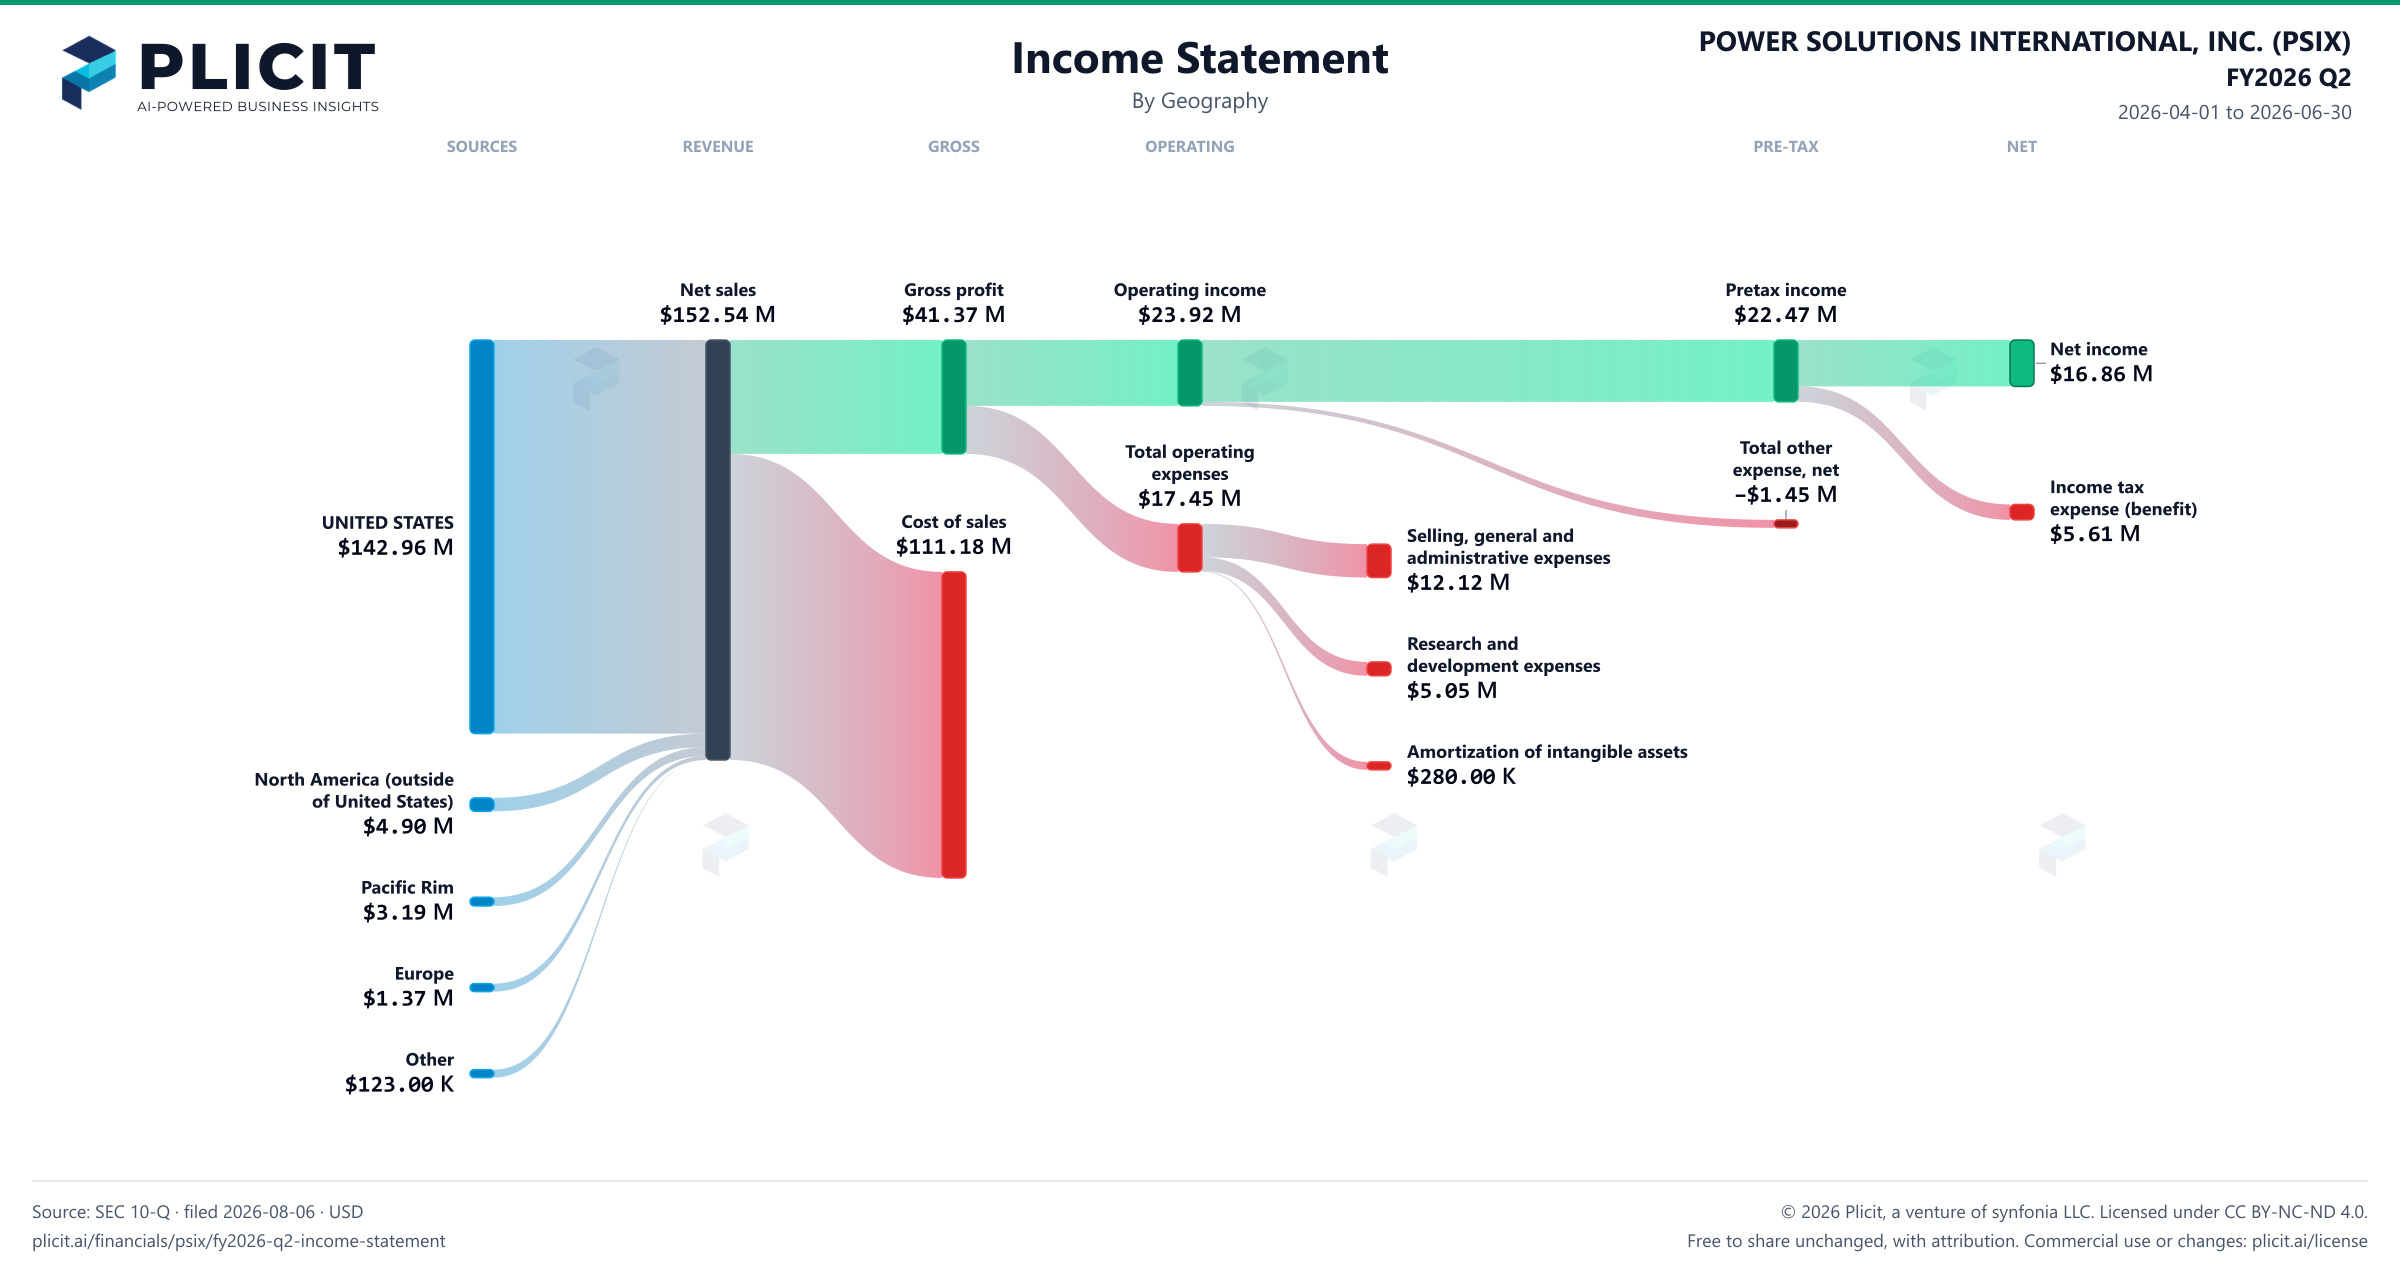
POWER SOLUTIONS INTERNATIONAL, INC. (PSIX) FY2026 Q2 Revenue by Geography Sankey chart
Free to share unchanged, with credit to Plicit.ai · CC BY-NC-ND 4.0Download PNG

Gross margin

27.1%

Gross profit / revenue

Operating margin

15.7%

Operating profit / revenue

Cash conversion

335.7%

Operating cash / net income, same period

Newsletter

Get the teardowns by email

Subscribe if you want the public-company teardowns in your inbox when they're released.

Product waitlist

Health Check and Teardown for your own company

A health check uncovers insights of your private books, not a public ticker. Join this list to get notified as soon as we go-live!