
PriceSmart, Inc. (PSMT) FY2026 Q3 Balance Sheet

Balance Sheet

As of 2026-05-31

Swipe to see the full flow
PriceSmart, Inc. (PSMT) FY2026 Q3 Balance SheetBalance sheet as of 2026-05-31. The chart shows assets, liabilities and equity at that date.Current liabilities$833.01 MCurrent assets$1.06 BLiabilities$1.13 BAssets$2.52 BEquity$1.39 BNon-current liabilities$293.78 MNon-current assets$1.46 BGross equity(calculated)$1.63 BHOLDINGSASSET CLASSASSETSCLAIM CLASSCLAIM SUB-CLASSCLAIMSMerchandise inventoriesCash and cash equivalentsShort-term investmentsPrepaid expenses and other current assets (includes $860 and $0 as of May 31, 2026 and August 31, 2025, respectively, for the fair value of derivative instruments)Receivables, net of allowance for credit losses of $0 and $2 as of May 31, 2026 and August 31, 2025, respectivelyShort-term restricted cashProperty and equipment, netOperating lease right-of-use assets, netOther non-current assets (includes $469 and $701 as of May 31, 2026 and August 31, 2025, respectively, for the fair value of derivative instruments)Deferred tax assetsGoodwillLong-term restricted cashAccounts payableOther accrued expenses and other current liabilities (includes $7,227 and $551 as of May 31, 2026 and August 31, 2025, respectively, for the fair value of derivative instruments)Long-term debt, current portionAccrued salaries and benefitsDeferred incomeDividends payableOperating lease liabilities, current portionShort-term borrowingsIncome taxes payableLong-term operating lease liabilitiesLong-term debt, net of current portionOther long-term liabilities (includes $2,613 and $6,196 for the fair value of derivative instruments and $14,745 and $13,628 for post-employment plans as of May 31, 2026 and August 31, 2025, respectively)Long-term income taxes payable, net of current portionDeferred tax liabilityRetained earningsAdditional paid-in capitalCommon stock $0.0001 par value, 45,000,000 shares authorized; 32,817,994 and 32,688,047 shares issued and 30,860,524 and 30,745,833 shares outstanding (net of treasury shares) as of May 31, 2026 and August 31, 2025, respectivelyCurrent assetsNon-current assetsAssetsCurrent liabilitiesNon-current liabilitiesLiabilitiesEquityGross equity (calculated)Less: treasury stock at cost, 1,957,470 shares as of May 31, 2026 and 1,942,214 shares as of August 31, 2025Accumulated other comprehensive lossAccounts payableAccounts payable$556.67 MOther accrued expenses and other current liabilities (includes $7,227 and $551 as of May 31, 2026 and August 31, 2025, respectively, for the fair value of derivative instruments)Other accrued expenses and other current liabilities$67.94 MCurrent liabilitiesCurrent liabilities$833.01 MLong-term debt, current portionLong-term debt, current portion$65.34 MMerchandise inventoriesMerchandise inventories$623.05 MCurrent assetsCurrent assets$1.06 BAccrued salaries and benefitsAccrued salaries and benefits$58.16 MCash and cash equivalentsCash and cash equivalents$208.44 MDeferred incomeDeferred income$50.50 MLiabilitiesLiabilities$1.13 BShort-term investmentsShort-term investments$113.75 MDividends payableDividends payable$21.68 MAssetsAssets$2.52 BOperating lease liabilities, current portionOperating lease liabilities, current portion$7.89 MPrepaid expenses and other current assets (includes $860 and $0 as of May 31, 2026 and August 31, 2025, respectively, for the fair value of derivative instruments)Prepaid expenses and other current assets$88.29 MShort-term borrowingsShort-term borrowings$3.45 MReceivables, net of allowance for credit losses of $0 and $2 as of May 31, 2026 and August 31, 2025, respectivelyReceivables, net$19.84 MIncome taxes payableIncome taxes payable$1.40 MShort-term restricted cashShort-term restricted cash$10.36 MLong-term operating lease liabilitiesLong-term operating lease liabilities$134.42 MEquityEquity$1.39 BNon-current liabilitiesNon-current liabilities$293.78 MLong-term debt, net of current portionLong-term debt, net of current portion$114.37 MNon-current assetsNon-current assets$1.46 BProperty and equipment, netProperty and equipment, net$1.11 BOther long-term liabilities (includes $2,613 and $6,196 for the fair value of derivative instruments and $14,745 and $13,628 for post-employment plans as of May 31, 2026 and August 31, 2025, respectively)Other long-term liabilities$39.71 MLong-term income taxes payable, net of current portionLong-term income taxes payable, net of current portion$4.55 MOperating lease right-of-use assets, netOperating lease right-of-use assets, net$125.38 MDeferred tax liabilityDeferred tax liability$738.00 KGross equity (calculated)Gross equity(calculated)$1.63 BOther non-current assets (includes $469 and $701 as of May 31, 2026 and August 31, 2025, respectively, for the fair value of derivative instruments)Other non-current assets$93.47 MDeferred tax assetsDeferred tax assets$44.52 MRetained earningsRetained earnings$1.09 BGoodwillGoodwill$43.29 MLong-term restricted cashLong-term restricted cash$35.82 MAdditional paid-in capitalAdditional paid-in capital$542.12 MCommon stock $0.0001 par value, 45,000,000 shares authorized; 32,817,994 and 32,688,047 shares issued and 30,860,524 and 30,745,833 shares outstanding (net of treasury shares) as of May 31, 2026 and August 31, 2025, respectivelyCommon stock $0.0001 par value$3.00 KLess: treasury stock at cost, 1,957,470 shares as of May 31, 2026 and 1,942,214 shares as of August 31, 2025Less: treasury stock at cost−$125.51 MAccumulated other comprehensive lossAccumulated other comprehensive loss−$109.27 M
Chart details

PriceSmart, Inc. (PSMT) FY2026 Q3 Balance Sheet

Balance sheet as of 2026-05-31. The chart shows assets, liabilities and equity at that date.

Assets
2,519,203,000 US dollars
Current assets
1,063,722,000 US dollars
Non-current assets
1,455,481,000 US dollars
Liabilities
1,126,795,000 US dollars
Current liabilities
833,014,000 US dollars
Non-current liabilities
293,781,000 US dollars
Equity
1,392,408,000 US dollars
Merchandise inventories
623,052,000 US dollars
Cash and cash equivalents
208,443,000 US dollars
Short-term investments
113,748,000 US dollars
Prepaid expenses and other current assets (includes $860 and $0 as of May 31, 2026 and August 31, 2025, respectively, for the fair value of derivative instruments)
88,287,000 US dollars
Receivables, net of allowance for credit losses of $0 and $2 as of May 31, 2026 and August 31, 2025, respectively
19,837,000 US dollars
Short-term restricted cash
10,355,000 US dollars
Property and equipment, net
1,112,996,000 US dollars
Operating lease right-of-use assets, net
125,382,000 US dollars
Other non-current assets (includes $469 and $701 as of May 31, 2026 and August 31, 2025, respectively, for the fair value of derivative instruments)
93,470,000 US dollars
Deferred tax assets
44,516,000 US dollars
Goodwill
43,293,000 US dollars
Long-term restricted cash
35,824,000 US dollars
Investment in unconsolidated affiliates
0 US dollars
Accounts payable
556,665,000 US dollars
Other accrued expenses and other current liabilities (includes $7,227 and $551 as of May 31, 2026 and August 31, 2025, respectively, for the fair value of derivative instruments)
67,937,000 US dollars
Long-term debt, current portion
65,335,000 US dollars
Accrued salaries and benefits
58,159,000 US dollars
Deferred income
50,500,000 US dollars
Dividends payable
21,683,000 US dollars
Operating lease liabilities, current portion
7,888,000 US dollars
Short-term borrowings
3,445,000 US dollars
Income taxes payable
1,402,000 US dollars
Long-term operating lease liabilities
134,421,000 US dollars
Long-term debt, net of current portion
114,365,000 US dollars
Other long-term liabilities (includes $2,613 and $6,196 for the fair value of derivative instruments and $14,745 and $13,628 for post-employment plans as of May 31, 2026 and August 31, 2025, respectively)
39,706,000 US dollars
Long-term income taxes payable, net of current portion
4,551,000 US dollars
Deferred tax liability
738,000 US dollars
Retained earnings
1,085,064,000 US dollars
Additional paid-in capital
542,116,000 US dollars
Common stock $0.0001 par value, 45,000,000 shares authorized; 32,817,994 and 32,688,047 shares issued and 30,860,524 and 30,745,833 shares outstanding (net of treasury shares) as of May 31, 2026 and August 31, 2025, respectively
3,000 US dollars
Less: treasury stock at cost, 1,957,470 shares as of May 31, 2026 and 1,942,214 shares as of August 31, 2025
negative 125,508,000 US dollars
Accumulated other comprehensive loss
negative 109,267,000 US dollars
Gross equity (calculated)
1,627,183,000 US dollars. Net equity plus the magnitudes of its negative contributions equals gross positive equity. The negative contributions enter this reconciliation as add-backs; their filed signs stay negative.

Chart connections

  • Assets equal liabilities plus consolidated equity. Consolidated equity includes noncontrolling interests when reported.
  • Treasury shares and other negative equity contributions reduce equity.
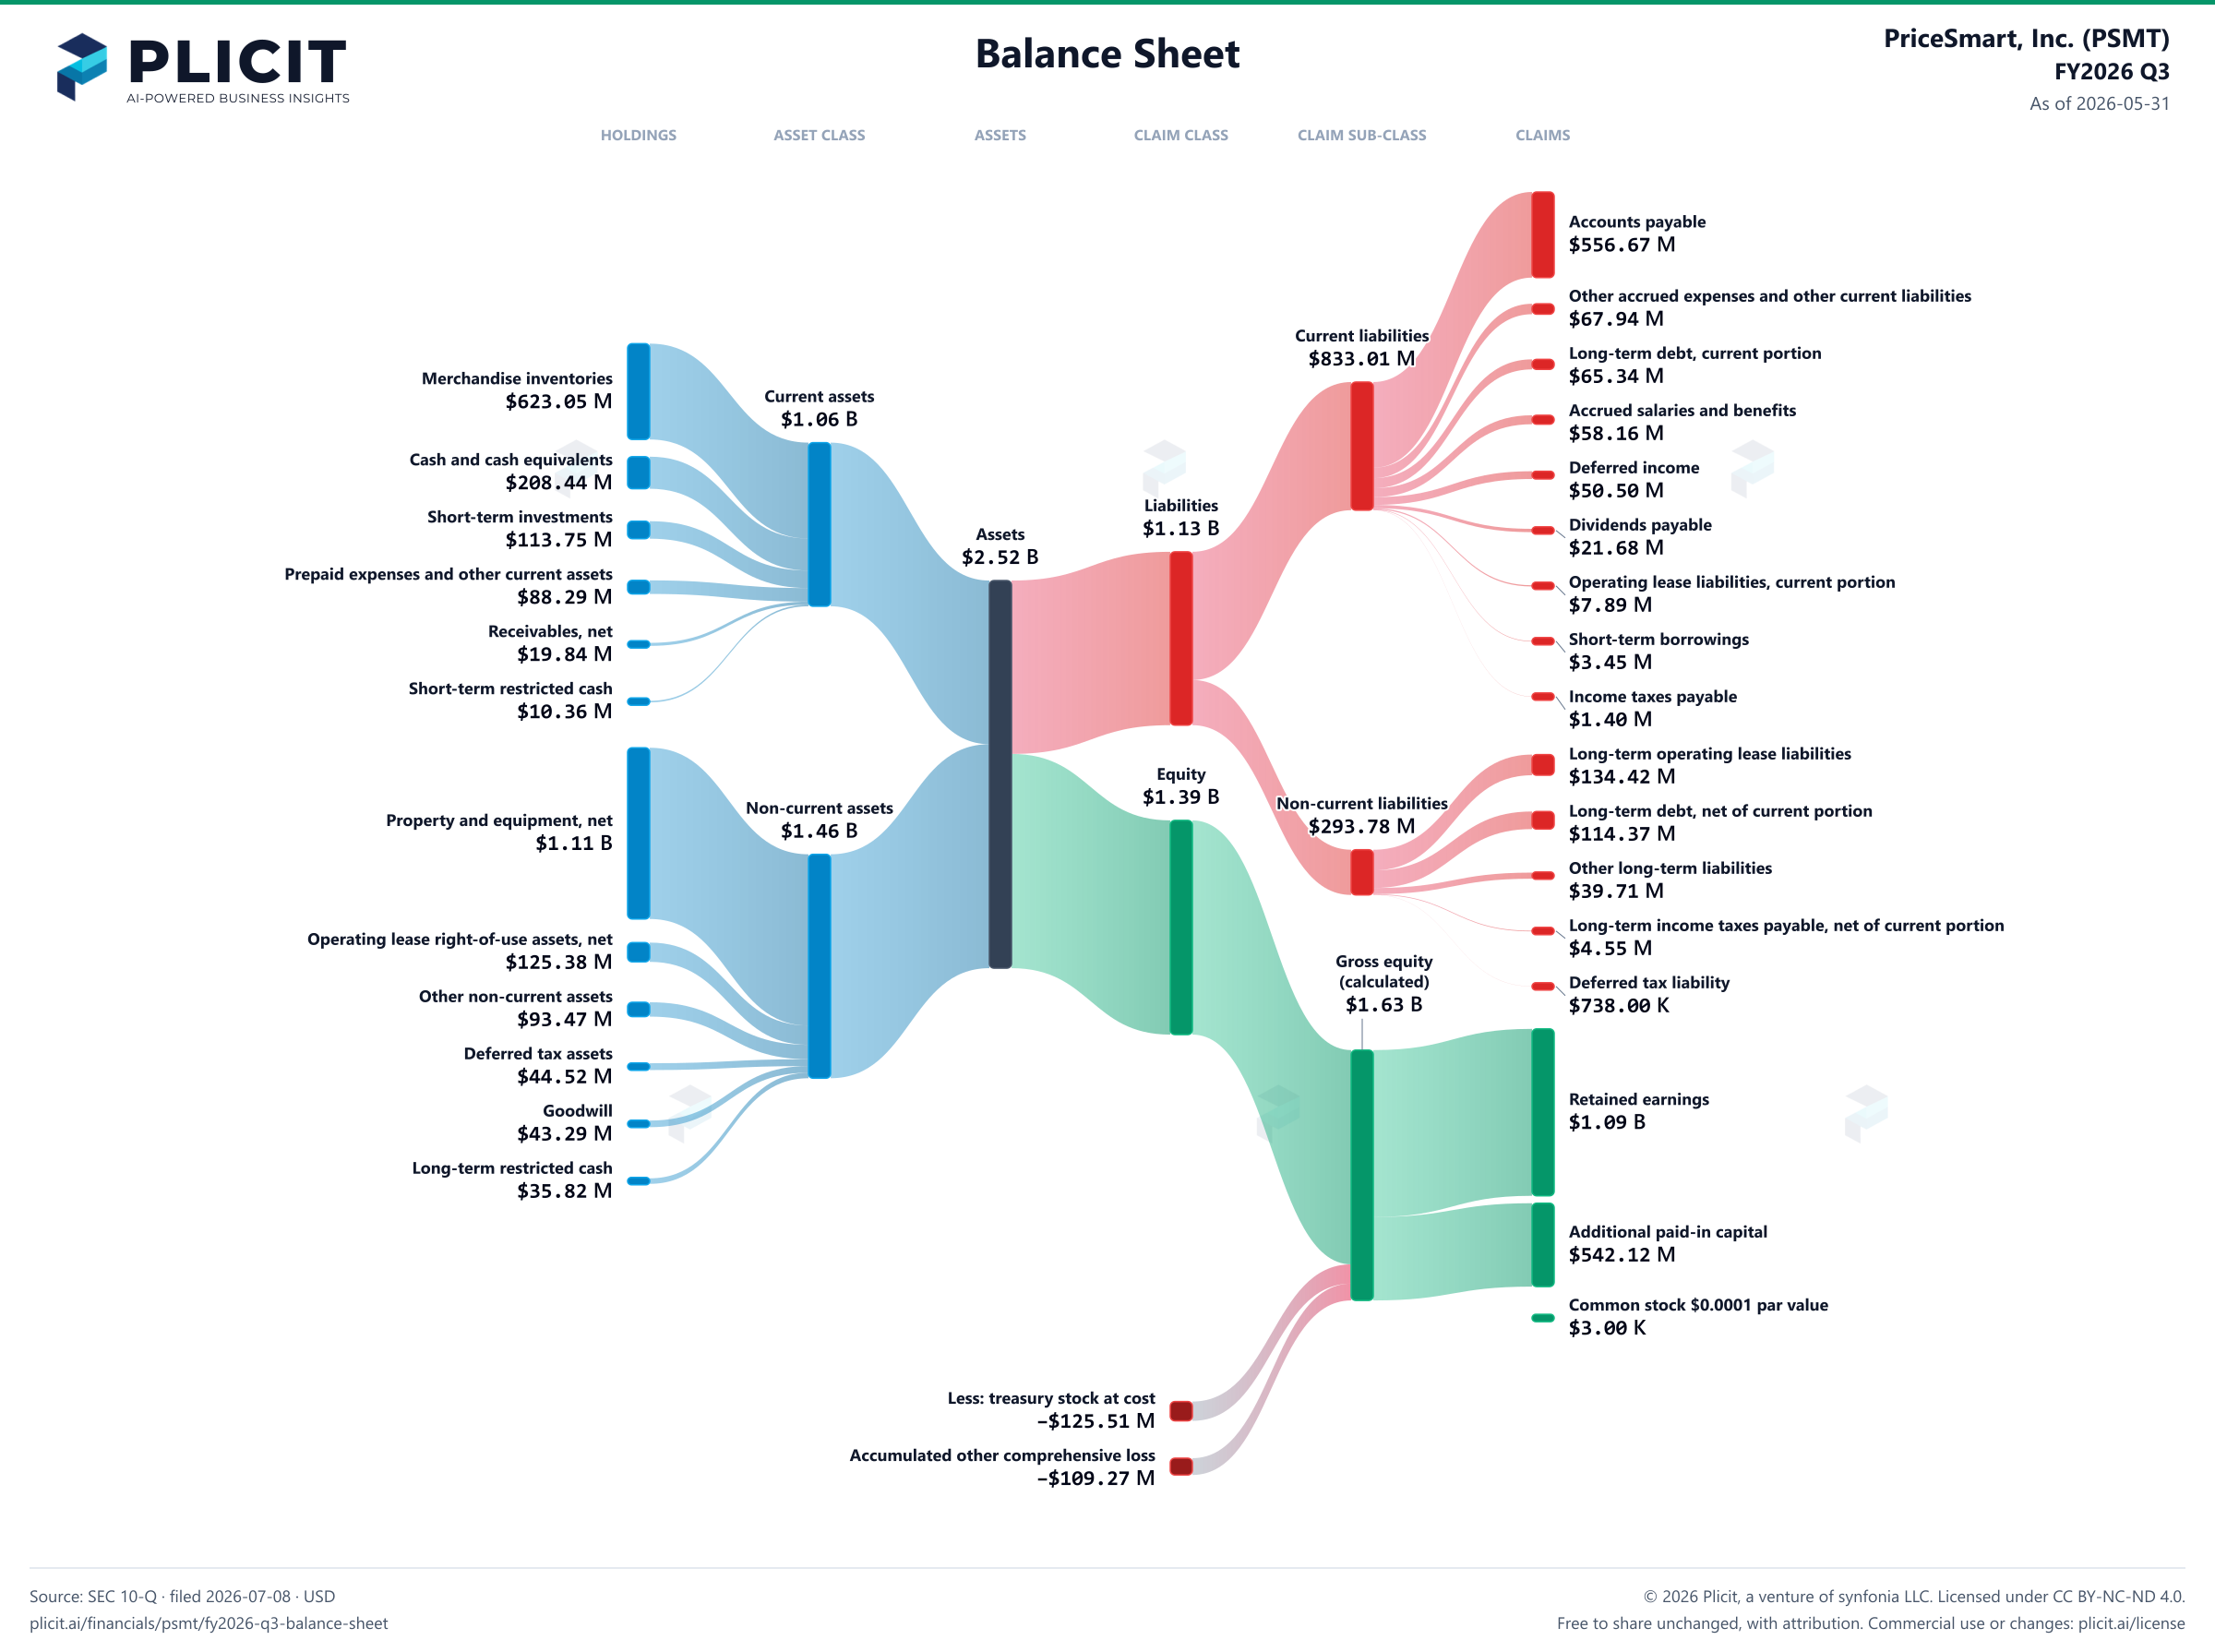
PriceSmart, Inc. (PSMT) FY2026 Q3 Balance Sheet Sankey chart
Free to share unchanged, with credit to Plicit.ai · CC BY-NC-ND 4.0Download PNG

Newsletter

Get the teardowns by email

Subscribe if you want the public-company teardowns in your inbox when they're released.

Product waitlist

Health Check and Teardown for your own company

A health check uncovers insights of your private books, not a public ticker. Join this list to get notified as soon as we go-live!