
RPC, INC. (RES) FY2026 Q2 Balance Sheet

Balance Sheet

As of 2026-06-30

Swipe to see the full flow
RPC, INC. (RES) FY2026 Q2 Balance SheetBalance sheet as of 2026-06-30. The chart shows assets, liabilities and equity at that date.Current liabilities$217.31 MCurrent assets$725.97 MLiabilities$351.01 MAssets$1.46 BEquity$1.11 BNon-current liabilities$133.69 MNon-current assets$733.78 MGross equity(calculated)$1.11 BHOLDINGSASSET CLASSASSETSCLAIM CLASSCLAIM SUB-CLASSCLAIMSAccounts receivable, netCash and cash equivalentsInventoriesOther current assetsPrepaid expensesIncome taxes receivableProperty, plant and equipment, netOther intangibles, netGoodwillOperating lease right-of-use assetsOther assetsFinance lease right-of-use assetsAccounts payableAccrued payroll and related expensesCurrent portion of notes payableAccrued insurance expensesAccrued state, local and other taxesCurrent portion of operating lease liabilitiesAccrued expenses and other liabilitiesCurrent portion of finance lease liabilitiesIncome taxes payableDeferred income taxesNotes payableAccrued insurance expensesOperating lease liabilitiesOther long-term liabilitiesFinance lease liabilitiesRetained earningsCommon stock, $0.10 par value, 349,000,000 shares authorized, 221,657,012 and 220,571,673 shares issued and outstanding in 2026 and 2025, respectivelyCurrent assetsNon-current assetsAssetsCurrent liabilitiesNon-current liabilitiesLiabilitiesEquityGross equity (calculated)Accumulated other comprehensive lossAccounts payableAccounts payable$146.97 MAccrued payroll and related expensesAccrued payroll and related expenses$33.19 MCurrent portion of notes payableCurrent portion of notes payable$10.00 MCurrent liabilitiesCurrent liabilities$217.31 MAccrued insurance expensesAccrued insurance expenses$8.06 MAccounts receivable, netAccounts receivable, net$378.54 MCurrent assetsCurrent assets$725.97 MAccrued state, local and other taxesAccrued state, local and other taxes$6.07 MCurrent portion of operating lease liabilitiesCurrent portion of operating lease liabilities$5.76 MCash and cash equivalentsCash and cash equivalents$179.47 MAccrued expenses and other liabilitiesAccrued expenses and other liabilities$5.43 MLiabilitiesLiabilities$351.01 MAssetsAssets$1.46 BInventoriesInventories$125.79 MCurrent portion of finance lease liabilitiesCurrent portion of finance lease liabilities$941.00 KOther current assetsOther current assets$23.22 MIncome taxes payableIncome taxes payable$896.00 KPrepaid expensesPrepaid expenses$15.54 MDeferred income taxesDeferred income taxes$74.32 MEquityEquity$1.11 BIncome taxes receivableIncome taxes receivable$3.41 MNotes payableNotes payable$20.00 MNon-current liabilitiesNon-current liabilities$133.69 MAccrued insurance expensesAccrued insurance expenses$17.25 MProperty, plant and equipment, netProperty, plant and equipment, net$519.01 MNon-current assetsNon-current assets$733.78 MOperating lease liabilitiesOperating lease liabilities$14.42 MOther long-term liabilitiesOther long-term liabilities$6.94 MOther intangibles, netOther intangibles, net$93.76 MFinance lease liabilitiesFinance lease liabilities$756.00 KGross equity (calculated)Gross equity(calculated)$1.11 BGoodwillGoodwill$81.25 MOperating lease right-of-use assetsOperating lease right-of-use assets$19.47 MOther assetsOther assets$18.67 MRetained earningsRetained earnings$1.09 BFinance lease right-of-use assetsFinance lease right-of-use assets$1.62 MCommon stock, $0.10 par value, 349,000,000 shares authorized, 221,657,012 and 220,571,673 shares issued and outstanding in 2026 and 2025, respectivelyCommon stock$22.17 MAccumulated other comprehensive lossAccumulated other comprehensive loss−$2.82 M
Chart details

RPC, INC. (RES) FY2026 Q2 Balance Sheet

Balance sheet as of 2026-06-30. The chart shows assets, liabilities and equity at that date.

Assets
1,459,755,000 US dollars
Current assets
725,974,000 US dollars
Non-current assets
733,781,000 US dollars
Liabilities
351,006,000 US dollars
Current liabilities
217,313,000 US dollars
Non-current liabilities
133,693,000 US dollars
Equity
1,108,749,000 US dollars
Accounts receivable, net
378,538,000 US dollars
Cash and cash equivalents
179,468,000 US dollars
Inventories
125,793,000 US dollars
Other current assets
23,220,000 US dollars
Prepaid expenses
15,544,000 US dollars
Income taxes receivable
3,411,000 US dollars
Property, plant and equipment, net
519,012,000 US dollars
Other intangibles, net
93,764,000 US dollars
Goodwill
81,249,000 US dollars
Operating lease right-of-use assets
19,466,000 US dollars
Other assets
18,667,000 US dollars
Finance lease right-of-use assets
1,623,000 US dollars
Accounts payable
146,966,000 US dollars
Accrued payroll and related expenses
33,188,000 US dollars
Current portion of notes payable
10,000,000 US dollars
Accrued insurance expenses
8,063,000 US dollars
Accrued state, local and other taxes
6,066,000 US dollars
Current portion of operating lease liabilities
5,759,000 US dollars
Accrued expenses and other liabilities
5,434,000 US dollars
Current portion of finance lease liabilities
941,000 US dollars
Income taxes payable
896,000 US dollars
Deferred income taxes
74,319,000 US dollars
Notes payable
20,000,000 US dollars
Accrued insurance expenses
17,254,000 US dollars
Operating lease liabilities
14,423,000 US dollars
Other long-term liabilities
6,941,000 US dollars
Finance lease liabilities
756,000 US dollars
Retained earnings
1,089,403,000 US dollars
Common stock, $0.10 par value, 349,000,000 shares authorized, 221,657,012 and 220,571,673 shares issued and outstanding in 2026 and 2025, respectively
22,166,000 US dollars
Capital in excess of par value
0 US dollars
Accumulated other comprehensive loss
negative 2,820,000 US dollars
Gross equity (calculated)
1,111,569,000 US dollars. Net equity plus the magnitudes of its negative contributions equals gross positive equity. The negative contributions enter this reconciliation as add-backs; their filed signs stay negative.

Chart connections

  • Assets equal liabilities plus consolidated equity. Consolidated equity includes noncontrolling interests when reported.
  • Treasury shares and other negative equity contributions reduce equity.
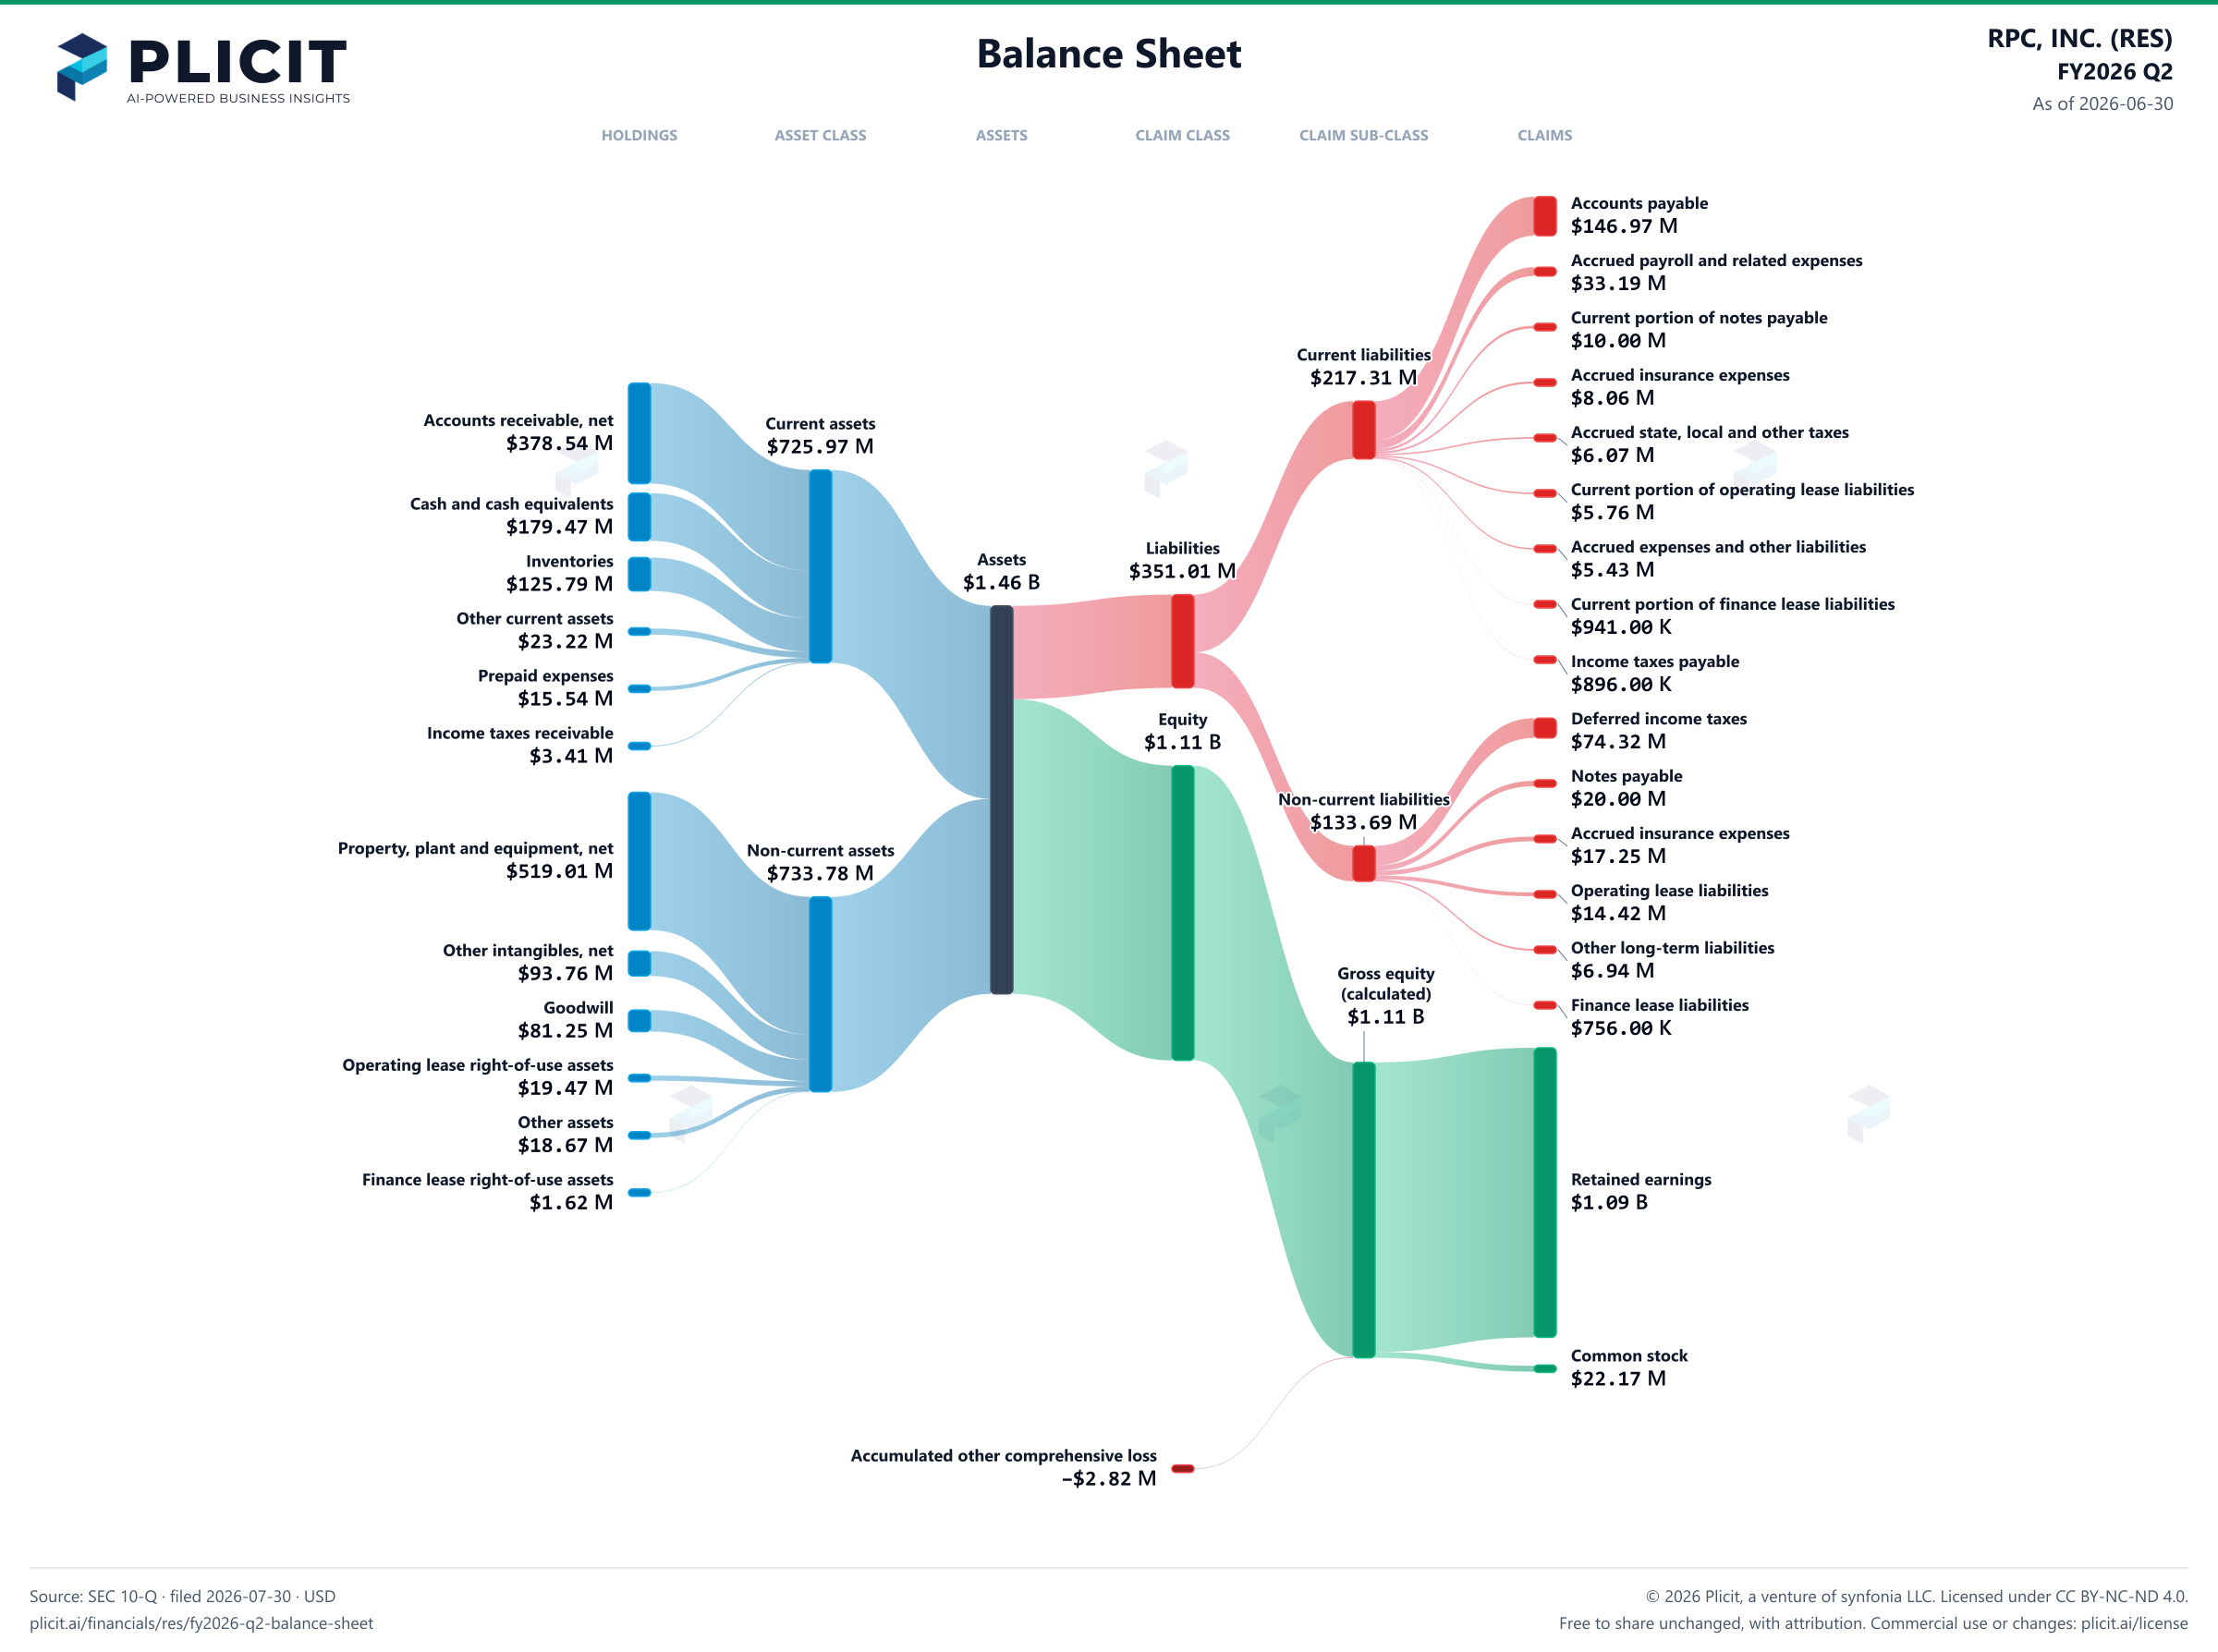
RPC, INC. (RES) FY2026 Q2 Balance Sheet Sankey chart
Free to share unchanged, with credit to Plicit.ai · CC BY-NC-ND 4.0Download PNG

Newsletter

Get the teardowns by email

Subscribe if you want the public-company teardowns in your inbox when they're released.

Product waitlist

Health Check and Teardown for your own company

A health check uncovers insights of your private books, not a public ticker. Join this list to get notified as soon as we go-live!