
Royal Gold, Inc (RGLD) FY2026 Q2 P&L / Income Statement

Revenue by Business Segment by Geography

2026-04-01 to 2026-06-30

Swipe to see the full flow
Royal Gold, Inc (RGLD) FY2026 Q2 P&L / Income StatementIncome statement for 2026-04-01 through 2026-06-30. View: Segments by Geographical. Revenue uses this breakdown; costs and expenses retain the consolidated categories.SOURCESREVENUEGROSSOPERATINGPRE-TAXNETStream interest - North AmericaRoyalty interest - North AmericaStream interest - EMEAStream interest - South and Central AmericaRoyalty interest - South and Central AmericaRoyalty interest - AUSTRALIARoyalty interest - EMEAStream interest - AUSTRALIARevenue (Note 9)Gross profit (calculated)Cost of revenue (calculated)Cost of sales (excludes depreciation, depletion and amortization)Operating incomeOperating costs, net of other operating income (calculated)Depreciation, depletion and amortizationGeneral and administrativeProduction taxesGain on settlement of Relief Canyon fixed obligationOther income (expense), net (calculated)Income before income taxesNet incomeIncome tax expense (Note 12)Other income (expense), net (calculated)Other income,net (calculated)$15.86 MGross profit (calculated)Gross profit(calculated)$390.45 MIncome before income taxesPretax income$295.80 MRevenue (Note 9)Revenue (Note 9)$450.54 MOperating incomeOperating income$279.94 MStream interest - North AmericaStream interest - North America$165.74 MNet incomeNet income$237.56 MRoyalty interest - North AmericaRoyalty interest - North America$84.64 MOperating costs, net of other operating income (calculated)Operating costs,net (calculated)$110.51 MStream interest - EMEAStream interest - EMEA$80.26 MIncome tax expense (Note 12)Income taxexpense (Note 12)$58.24 MDepreciation, depletion and amortizationDepreciation, depletionand amortization$96.20 MCost of revenue (calculated)Cost of revenue(calculated)$60.09 MStream interest - South and Central AmericaStream interest - Southand Central America$63.87 MGeneral and administrativeGeneral and administrative$13.45 MRoyalty interest - South and Central AmericaRoyalty interest - Southand Central America$35.68 MCost of sales (excludes depreciation, depletion and amortization)Cost of sales$60.09 MProduction taxesProduction taxes$3.44 MRoyalty interest - AUSTRALIARoyalty interest - AUSTRALIA$14.16 MGain on settlement of Relief Canyon fixed obligationGain on settlement of ReliefCanyon fixed obligation−$2.58 MRoyalty interest - EMEARoyalty interest - EMEA$5.09 MStream interest - AUSTRALIAStream interest - AUSTRALIA$1.10 M
Chart details

Royal Gold, Inc (RGLD) FY2026 Q2 P&L / Income Statement

Income statement for 2026-04-01 through 2026-06-30. View: Segments by Geographical. Revenue uses this breakdown; costs and expenses retain the consolidated categories.

Revenue (Note 9)
450,539,000 US dollars
Cost of revenue (calculated)
60,094,000 US dollars
Gross profit (calculated)
390,445,000 US dollars
Operating costs, net of other operating income (calculated)
110,507,000 US dollars
Operating income
279,938,000 US dollars
Other income (expense), net (calculated)
15,862,000 US dollars
Income before income taxes
295,800,000 US dollars
Income tax expense (Note 12)
58,241,000 US dollars
Net income
237,559,000 US dollars
Royalty interest - AUSTRALIA
14,164,000 US dollars
Royalty interest - South and Central America
35,678,000 US dollars
Royalty interest - North America
84,639,000 US dollars
Royalty interest - EMEA
5,094,000 US dollars
Stream interest - AUSTRALIA
1,098,000 US dollars
Stream interest - South and Central America
63,868,000 US dollars
Stream interest - North America
165,742,000 US dollars
Stream interest - EMEA
80,256,000 US dollars
Cost of sales (excludes depreciation, depletion and amortization)
60,094,000 US dollars
General and administrative
13,445,000 US dollars
Production taxes
3,437,000 US dollars
Depreciation, depletion and amortization
96,200,000 US dollars
Gain on settlement of Relief Canyon fixed obligation
negative 2,575,000 US dollars

Chart connections

  • Revenue less cost of revenue equals gross profit; gross profit less operating expenses equals operating income.
  • Operating income plus other income or expense equals income before tax. Income before tax less income tax expense or benefit equals net income.
  • Of which attributable to Royal Gold, Inc: $236.39 M; to noncontrolling interests: $1.17 M.
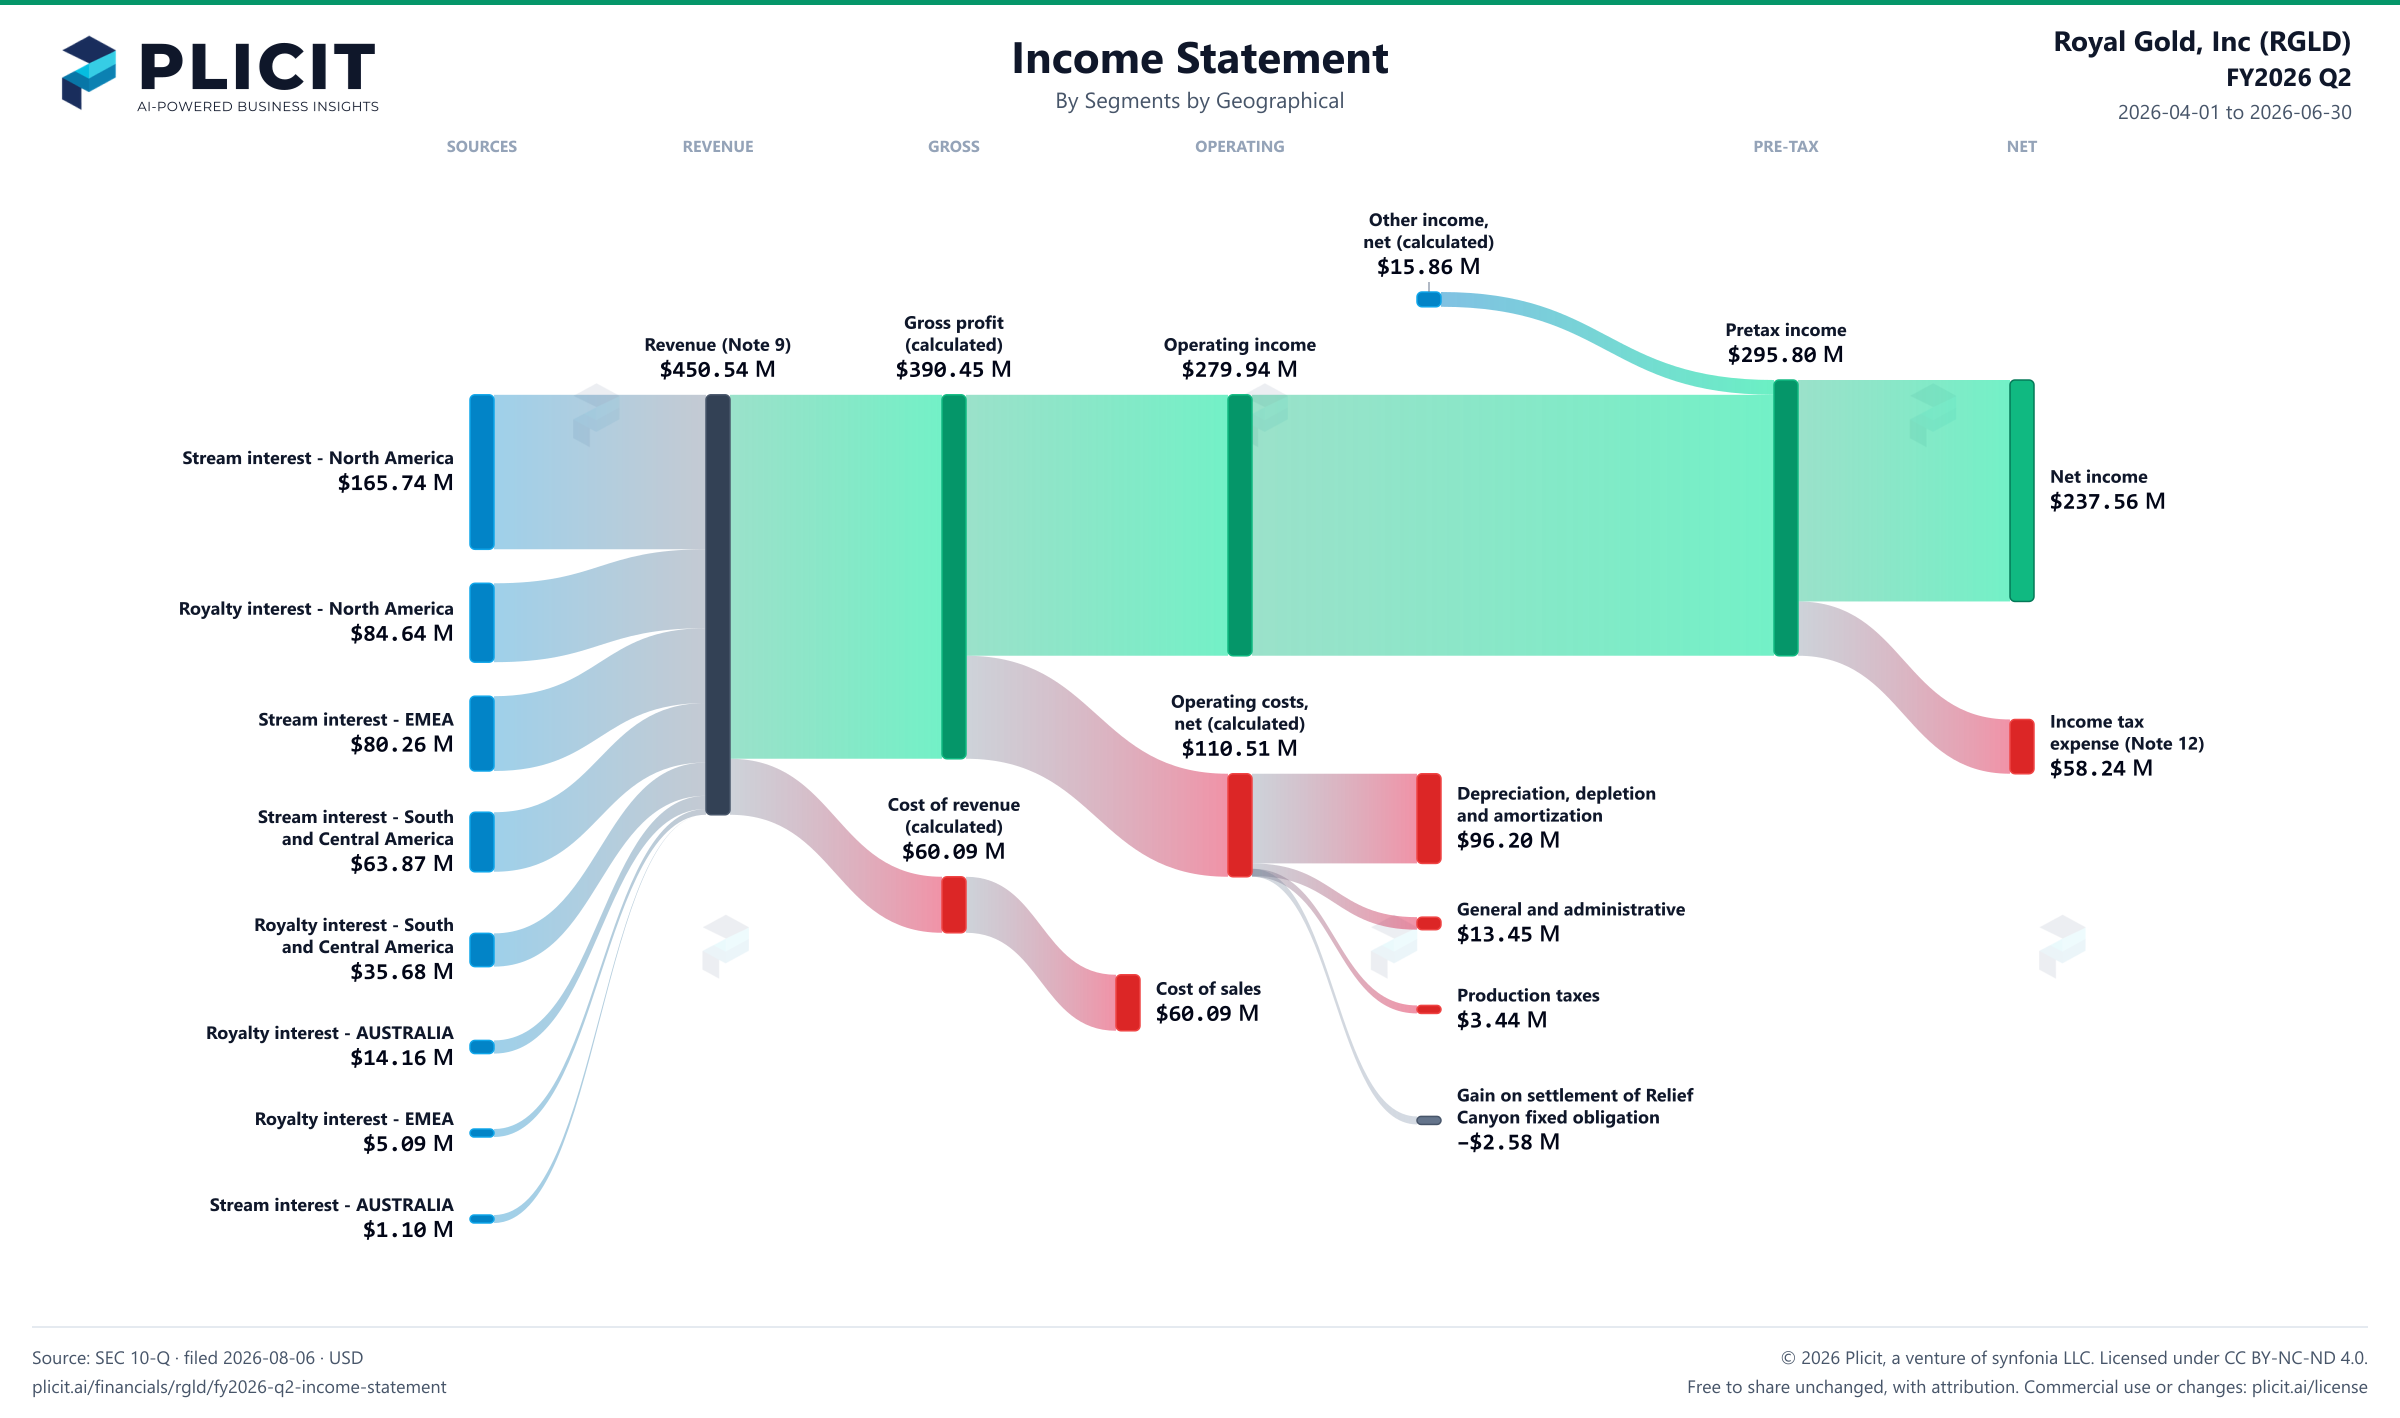
Royal Gold, Inc (RGLD) FY2026 Q2 Revenue by Business Segment by Geography Sankey chart
Free to share unchanged, with credit to Plicit.ai · CC BY-NC-ND 4.0Download PNG

Gross margin

86.7%

Gross profit / revenue

Operating margin

62.1%

Operating profit / revenue

Cash conversion

141.1%

Operating cash / net income, same period

Newsletter

Get the teardowns by email

Subscribe if you want the public-company teardowns in your inbox when they're released.

Product waitlist

Health Check and Teardown for your own company

A health check uncovers insights of your private books, not a public ticker. Join this list to get notified as soon as we go-live!