
RENAISSANCERE HOLDINGS LTD (RNR) FY2026 Q2 Balance Sheet

Balance Sheet

As of 2026-06-30

Swipe to see the full flow
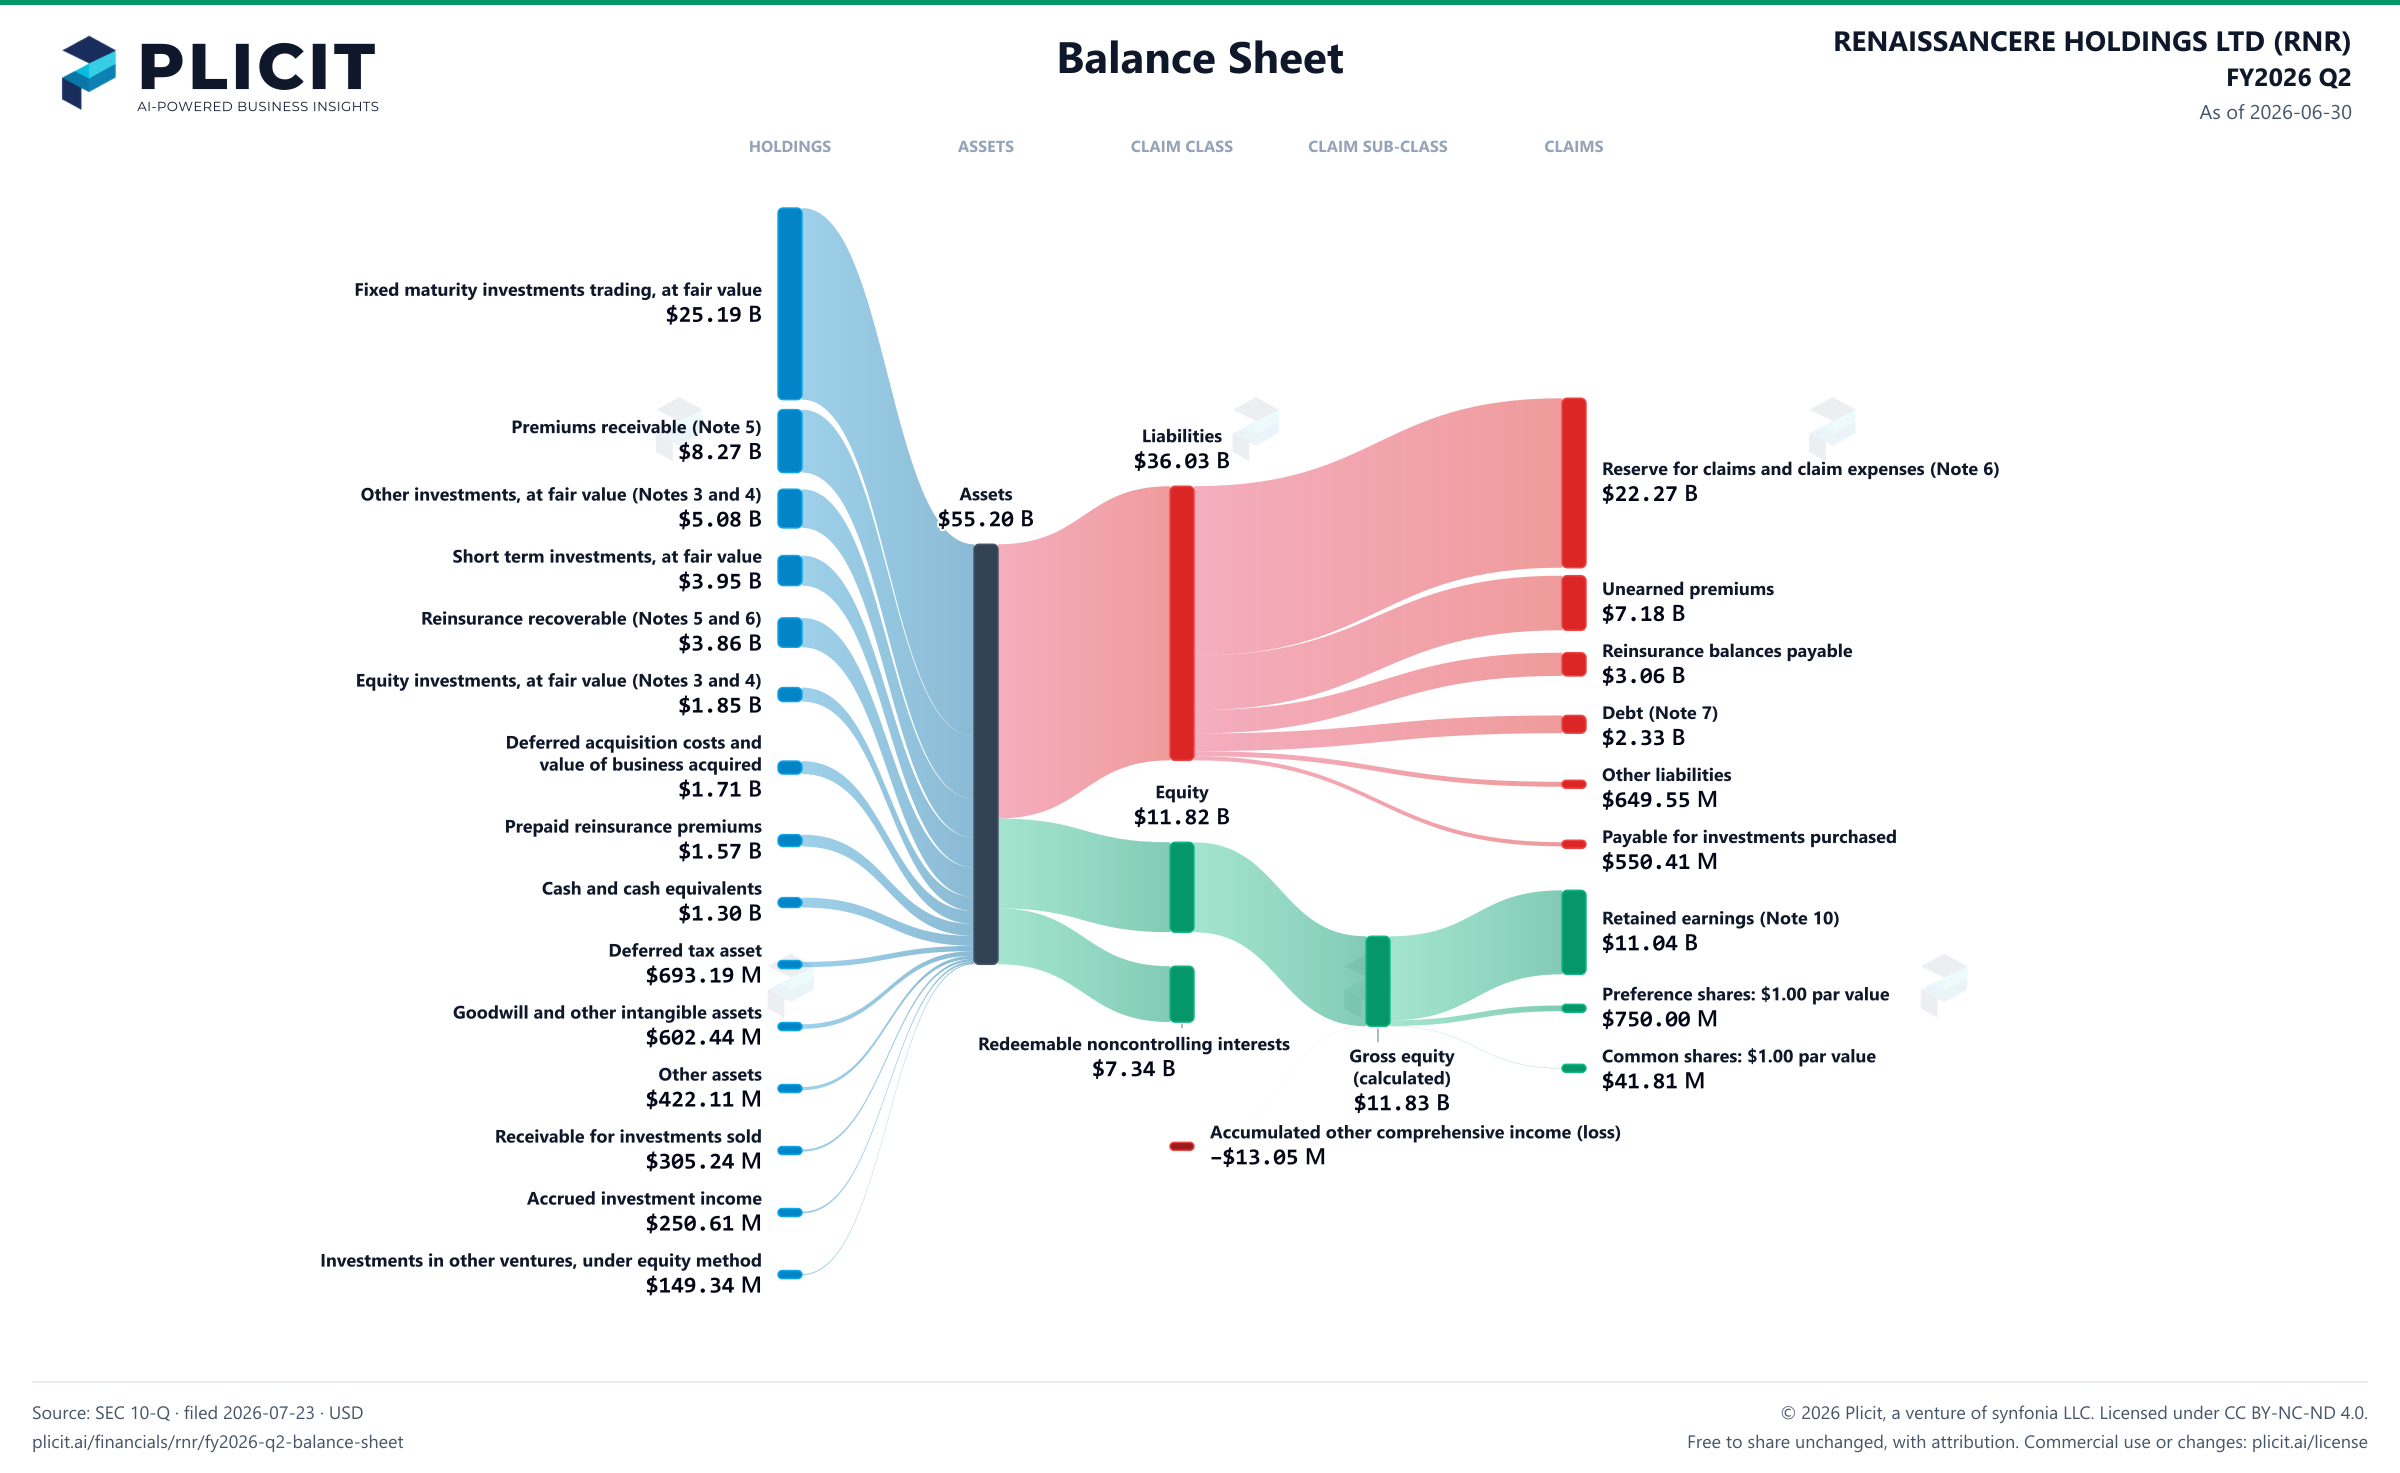
RENAISSANCERE HOLDINGS LTD (RNR) FY2026 Q2 Balance SheetBalance sheet as of 2026-06-30. The chart shows assets, liabilities and equity at that date.Liabilities$36.03 BAssets$55.20 BEquity$11.82 BGross equity(calculated)$11.83 BRedeemable noncontrolling interests$7.34 BHOLDINGSASSETSCLAIM CLASSCLAIM SUB-CLASSCLAIMSFixed maturity investments trading, at fair value - amortized cost $25,281,536 at June 30, 2026 (December 31, 2025 - $24,658,351) (Notes 3 and 4)Premiums receivable (Note 5)Other investments, at fair value (Notes 3 and 4)Short term investments, at fair value - amortized cost $3,952,780 at June 30, 2026 (December 31, 2025 - $4,760,027) (Notes 3 and 4)Reinsurance recoverable (Notes 5 and 6)Equity investments, at fair value (Notes 3 and 4)Deferred acquisition costs and value of business acquiredPrepaid reinsurance premiumsCash and cash equivalentsDeferred tax assetGoodwill and other intangible assetsOther assetsReceivable for investments soldAccrued investment incomeInvestments in other ventures, under equity methodReserve for claims and claim expenses (Note 6)Unearned premiumsReinsurance balances payableDebt (Note 7)Other liabilitiesPayable for investments purchasedRetained earnings (Note 10)Preference shares: $1.00 par value - 30,000 shares issued and outstanding at June 30, 2026 (December 31, 2025 - 30,000) (Note 10)Common shares: $1.00 par value - 41,811,353 shares issued and outstanding at June 30, 2026 (December 31, 2025 - 43,961,539) (Note 10)AssetsLiabilitiesEquityGross equity (calculated)Accumulated other comprehensive income (loss)Redeemable noncontrolling interests (Note 8)Fixed maturity investments trading, at fair value - amortized cost $25,281,536 at June 30, 2026 (December 31, 2025 - $24,658,351) (Notes 3 and 4)Fixed maturity investments trading, at fair value$25.19 BPremiums receivable (Note 5)Premiums receivable (Note 5)$8.27 BLiabilitiesLiabilities$36.03 BReserve for claims and claim expenses (Note 6)Reserve for claims and claim expenses (Note 6)$22.27 BAssetsAssets$55.20 BOther investments, at fair value (Notes 3 and 4)Other investments, at fair value (Notes 3 and 4)$5.08 BShort term investments, at fair value - amortized cost $3,952,780 at June 30, 2026 (December 31, 2025 - $4,760,027) (Notes 3 and 4)Short term investments, at fair value$3.95 BUnearned premiumsUnearned premiums$7.18 BReinsurance recoverable (Notes 5 and 6)Reinsurance recoverable (Notes 5 and 6)$3.86 BReinsurance balances payableReinsurance balances payable$3.06 BEquity investments, at fair value (Notes 3 and 4)Equity investments, at fair value (Notes 3 and 4)$1.85 BDebt (Note 7)Debt (Note 7)$2.33 BDeferred acquisition costs and value of business acquiredDeferred acquisition costs andvalue of business acquired$1.71 BOther liabilitiesOther liabilities$649.55 MEquityEquity$11.82 BPrepaid reinsurance premiumsPrepaid reinsurance premiums$1.57 BPayable for investments purchasedPayable for investments purchased$550.41 MGross equity (calculated)Gross equity(calculated)$11.83 BCash and cash equivalentsCash and cash equivalents$1.30 BRedeemable noncontrolling interests (Note 8)Redeemable noncontrolling interests$7.34 BRetained earnings (Note 10)Retained earnings (Note 10)$11.04 BDeferred tax assetDeferred tax asset$693.19 MPreference shares: $1.00 par value - 30,000 shares issued and outstanding at June 30, 2026 (December 31, 2025 - 30,000) (Note 10)Preference shares: $1.00 par value$750.00 MGoodwill and other intangible assetsGoodwill and other intangible assets$602.44 MCommon shares: $1.00 par value - 41,811,353 shares issued and outstanding at June 30, 2026 (December 31, 2025 - 43,961,539) (Note 10)Common shares: $1.00 par value$41.81 MOther assetsOther assets$422.11 MAccumulated other comprehensive income (loss)Accumulated other comprehensive income (loss)−$13.05 MReceivable for investments soldReceivable for investments sold$305.24 MAccrued investment incomeAccrued investment income$250.61 MInvestments in other ventures, under equity methodInvestments in other ventures, under equity method$149.34 M
Chart details

RENAISSANCERE HOLDINGS LTD (RNR) FY2026 Q2 Balance Sheet

Balance sheet as of 2026-06-30. The chart shows assets, liabilities and equity at that date.

Assets
55,195,613,000 US dollars
Liabilities
36,032,051,000 US dollars
Equity
11,820,209,000 US dollars
Redeemable noncontrolling interests (Note 8)
7,343,353,000 US dollars
Fixed maturity investments trading, at fair value - amortized cost $25,281,536 at June 30, 2026 (December 31, 2025 - $24,658,351) (Notes 3 and 4)
25,185,430,000 US dollars
Premiums receivable (Note 5)
8,269,415,000 US dollars
Other investments, at fair value (Notes 3 and 4)
5,083,169,000 US dollars
Short term investments, at fair value - amortized cost $3,952,780 at June 30, 2026 (December 31, 2025 - $4,760,027) (Notes 3 and 4)
3,949,012,000 US dollars
Reinsurance recoverable (Notes 5 and 6)
3,863,486,000 US dollars
Equity investments, at fair value (Notes 3 and 4)
1,846,152,000 US dollars
Deferred acquisition costs and value of business acquired
1,706,129,000 US dollars
Prepaid reinsurance premiums
1,567,745,000 US dollars
Cash and cash equivalents
1,302,160,000 US dollars
Deferred tax asset
693,186,000 US dollars
Goodwill and other intangible assets
602,439,000 US dollars
Other assets
422,106,000 US dollars
Receivable for investments sold
305,237,000 US dollars
Accrued investment income
250,610,000 US dollars
Investments in other ventures, under equity method
149,337,000 US dollars
Reserve for claims and claim expenses (Note 6)
22,269,134,000 US dollars
Unearned premiums
7,176,037,000 US dollars
Reinsurance balances payable
3,056,013,000 US dollars
Debt (Note 7)
2,330,907,000 US dollars
Other liabilities
649,551,000 US dollars
Payable for investments purchased
550,409,000 US dollars
Retained earnings (Note 10)
11,041,443,000 US dollars
Preference shares: $1.00 par value - 30,000 shares issued and outstanding at June 30, 2026 (December 31, 2025 - 30,000) (Note 10)
750,000,000 US dollars
Common shares: $1.00 par value - 41,811,353 shares issued and outstanding at June 30, 2026 (December 31, 2025 - 43,961,539) (Note 10)
41,811,000 US dollars
Additional paid-in capital (Note 10)
0 US dollars
Accumulated other comprehensive income (loss)
negative 13,045,000 US dollars
Gross equity (calculated)
11,833,254,000 US dollars. Net equity plus the magnitudes of its negative contributions equals gross positive equity. The negative contributions enter this reconciliation as add-backs; their filed signs stay negative.

Chart connections

  • Assets equal liabilities plus temporary equity plus consolidated equity. Consolidated equity includes noncontrolling interests when reported.
  • Treasury shares and other negative equity contributions reduce equity.
RENAISSANCERE HOLDINGS LTD (RNR) FY2026 Q2 Balance Sheet Sankey chart
Free to share unchanged, with credit to Plicit.ai · CC BY-NC-ND 4.0Download PNG

Newsletter

Get the teardowns by email

Subscribe if you want the public-company teardowns in your inbox when they're released.

Product waitlist

Health Check and Teardown for your own company

A health check uncovers insights of your private books, not a public ticker. Join this list to get notified as soon as we go-live!