
RUSH ENTERPRISES, INC. (RUSHA) FY2026 Q2 Balance Sheet
As of 2026-06-30
Balance Sheet
As of 2026-06-30
Swipe to see the full flow
Chart details
RUSH ENTERPRISES, INC. (RUSHA) FY2026 Q2 Balance Sheet
Balance sheet as of 2026-06-30. The chart shows assets, liabilities and equity at that date.
- Assets
- 4,659,529,000 US dollars
- Current assets
- 2,293,235,000 US dollars
- Non-current assets
- 2,366,294,000 US dollars
- Liabilities (calculated)
- 2,305,042,000 US dollars
- Current liabilities
- 1,579,501,000 US dollars
- Non-current liabilities
- 725,541,000 US dollars
- Equity
- 2,354,487,000 US dollars
- Noncontrolling interest
- 23,099,000 US dollars. Included in consolidated equity; this amount is not added again.
- Inventories, net
- 1,687,607,000 US dollars
- Accounts receivable, net
- 304,665,000 US dollars
- Cash, cash equivalents and restricted cash
- 264,937,000 US dollars
- Prepaid expenses and other
- 27,995,000 US dollars
- Note receivable, affiliate
- 8,031,000 US dollars
- Property and equipment, net
- 1,690,261,000 US dollars
- Goodwill, net
- 468,959,000 US dollars
- Operating lease right-of-use assets, net
- 125,180,000 US dollars
- Other assets, net
- 81,894,000 US dollars
- Floor plan notes payable
- 961,057,000 US dollars
- Trade accounts payable
- 299,119,000 US dollars
- Accrued expenses
- 159,299,000 US dollars
- Customer deposits
- 108,074,000 US dollars
- Current maturities of finance lease obligations
- 29,180,000 US dollars
- Current maturities of operating lease obligations
- 21,036,000 US dollars
- Current maturities of long-term debt
- 1,736,000 US dollars
- Long-term debt, net of current maturities
- 280,979,000 US dollars
- Deferred income taxes, net
- 213,354,000 US dollars
- Operating lease obligations, net of current maturities
- 107,135,000 US dollars
- Finance lease obligations, net of current maturities
- 84,027,000 US dollars
- Other long-term liabilities
- 40,046,000 US dollars
- Retained earnings
- 2,008,525,000 US dollars
- Additional paid-in capital
- 667,442,000 US dollars
- Common stock, par value $.01 per share; 105,000,000 Class A shares and 35,000,000 Class B shares authorized; 60,855,308 Class A shares and 16,715,210 Class B shares outstanding in 2026; and 60,115,093 Class A shares and 16,437,909 Class B shares outstanding in 2025
- 847,000 US dollars
- Preferred stock, par value $.01 per share; 1,000,000 shares authorized; 0 shares outstanding in 2026 and 2025
- 0 US dollars
- Noncontrolling interest
- 23,099,000 US dollars
- Treasury stock, at cost: 4,586,791 Class A shares and 2,352,163 Class B shares in 2026; and 4,586,791 Class A shares and 2,352,163 Class B shares in 2025
- negative 336,548,000 US dollars
- Accumulated other comprehensive (loss)
- negative 8,878,000 US dollars
- Gross equity (calculated)
- 2,699,913,000 US dollars. Net equity plus the magnitudes of its negative contributions equals gross positive equity. The negative contributions enter this reconciliation as add-backs; their filed signs stay negative.
Chart connections
- Assets equal liabilities plus consolidated equity. Consolidated equity includes noncontrolling interests when reported.
- Treasury shares and other negative equity contributions reduce equity.
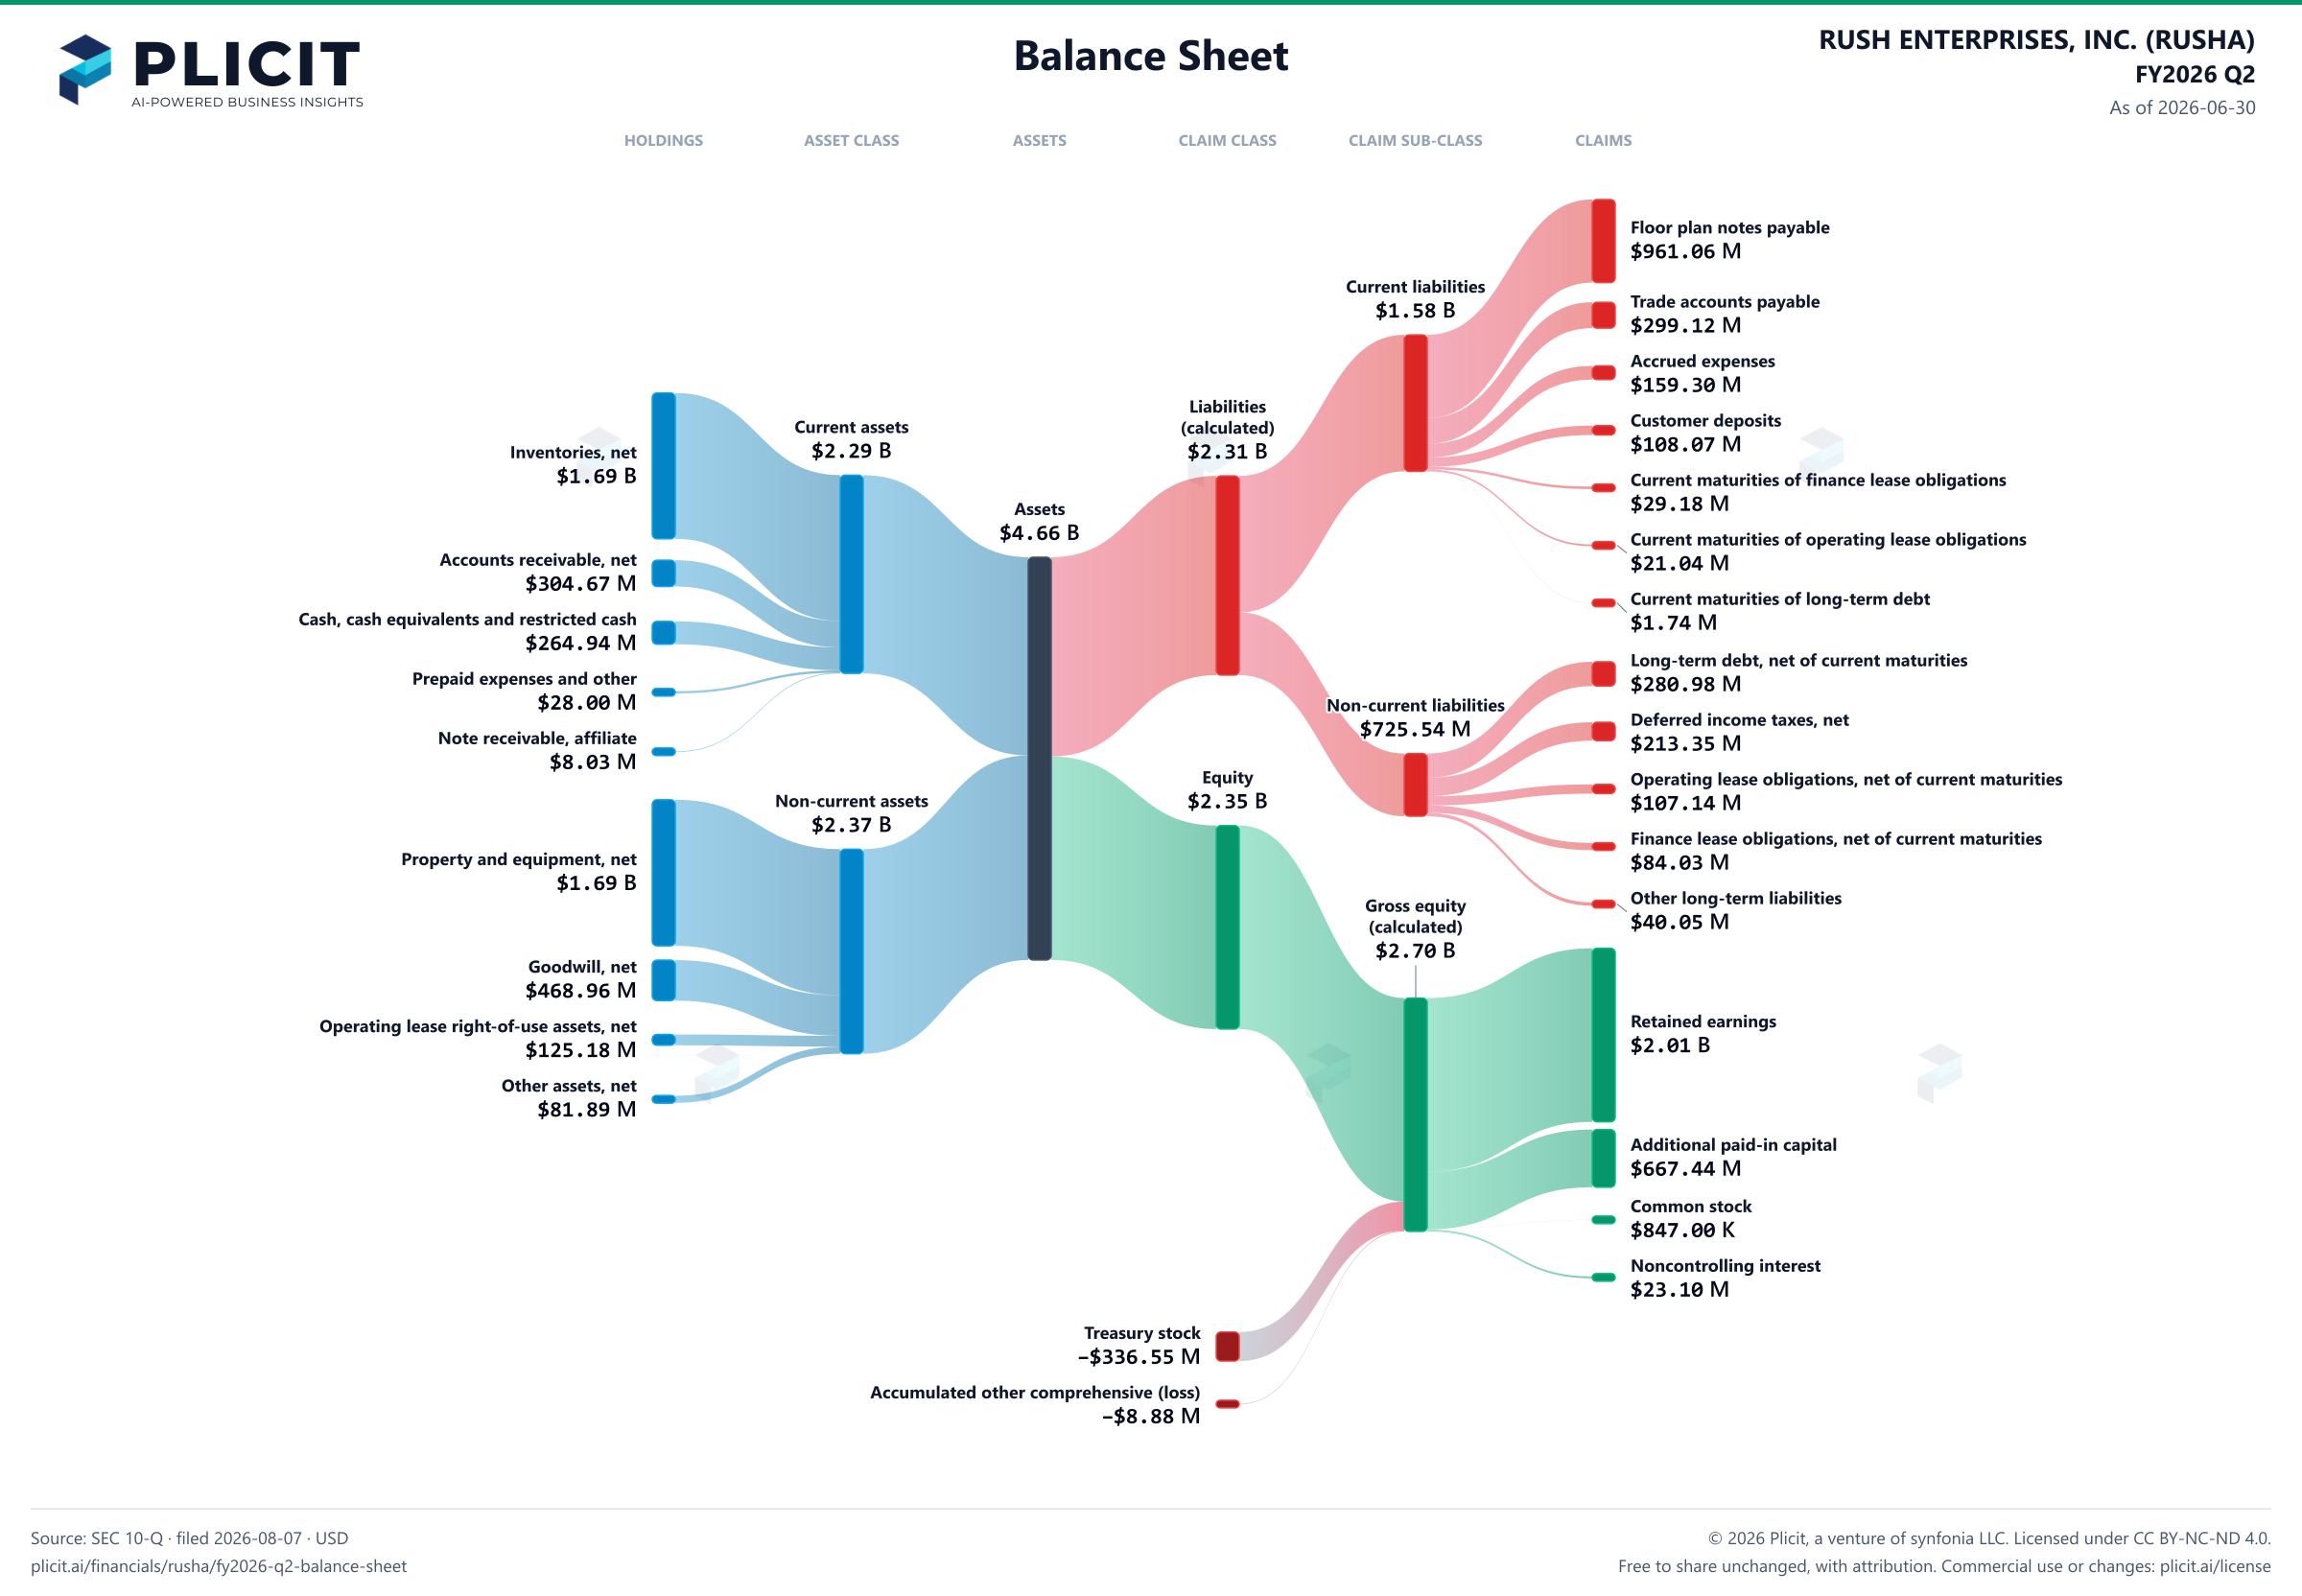
Free to share unchanged, with credit to Plicit.ai · CC BY-NC-ND 4.0Download PNG
Product waitlist
Health Check and Teardown for your own company
A health check uncovers insights of your private books, not a public ticker. Join this list to get notified as soon as we go-live!