
SAFETY INSURANCE GROUP, INC. (SAFT) FY2026 Q2 Balance Sheet
As of 2026-06-30
Balance Sheet
As of 2026-06-30
Swipe to see the full flow
Chart details
SAFETY INSURANCE GROUP, INC. (SAFT) FY2026 Q2 Balance Sheet
Balance sheet as of 2026-06-30. The chart shows assets, liabilities and equity at that date.
- Assets
- 2,503,284,000 US dollars
- Liabilities
- 1,626,630,000 US dollars
- Equity
- 876,654,000 US dollars
- Fixed maturities, available for sale, at fair value (amortized cost: $1,365,368 and $1,337,235, allowance for expected credit losses of $355 and $0)
- 1,328,594,000 US dollars
- Accounts receivable, net of allowance for expected credit losses of $890 and $802
- 332,530,000 US dollars
- Equity securities, at fair value (cost: $189,372 and $201,591)
- 201,956,000 US dollars
- Other invested assets
- 154,036,000 US dollars
- Receivable from reinsurers related to unpaid loss and loss adjustment expenses
- 150,659,000 US dollars
- Deferred policy acquisition costs
- 112,755,000 US dollars
- Cash and cash equivalents
- 67,918,000 US dollars
- Ceded unearned premiums
- 43,317,000 US dollars
- Receivable from reinsurers related to paid loss and loss adjustment expenses
- 25,074,000 US dollars
- Other assets
- 18,976,000 US dollars
- Goodwill
- 17,093,000 US dollars
- Accrued investment income
- 11,702,000 US dollars
- Taxes recoverable
- 10,731,000 US dollars
- Operating lease right-of-use-assets
- 9,773,000 US dollars
- Intangible assets
- 6,309,000 US dollars
- Deferred income taxes
- 6,253,000 US dollars
- Equity and deposits in pools
- 5,081,000 US dollars
- Receivable for securities sold
- 527,000 US dollars
- Losses and loss adjustment expense reserves
- 808,264,000 US dollars
- Unearned premium reserves
- 664,746,000 US dollars
- Accounts payable and accrued liabilities
- 70,299,000 US dollars
- Long-term debt
- 50,000,000 US dollars
- Payable to reinsurers
- 18,487,000 US dollars
- Operating lease liabilities
- 9,773,000 US dollars
- Payable for securities purchased
- 5,061,000 US dollars
- Retained earnings
- 837,302,000 US dollars
- Additional paid-in capital
- 238,435,000 US dollars
- Common stock: $0.01 par value; 30,000,000 shares authorized; 18,103,084 and 18,051,631 shares issued
- 181,000 US dollars
- Treasury stock, at cost: 3,419,947 shares
- negative 170,493,000 US dollars
- Accumulated other comprehensive loss, net of taxes
- negative 28,771,000 US dollars
- Gross equity (calculated)
- 1,075,918,000 US dollars. Net equity plus the magnitudes of its negative contributions equals gross positive equity. The negative contributions enter this reconciliation as add-backs; their filed signs stay negative.
Chart connections
- Assets equal liabilities plus consolidated equity. Consolidated equity includes noncontrolling interests when reported.
- Treasury shares and other negative equity contributions reduce equity.
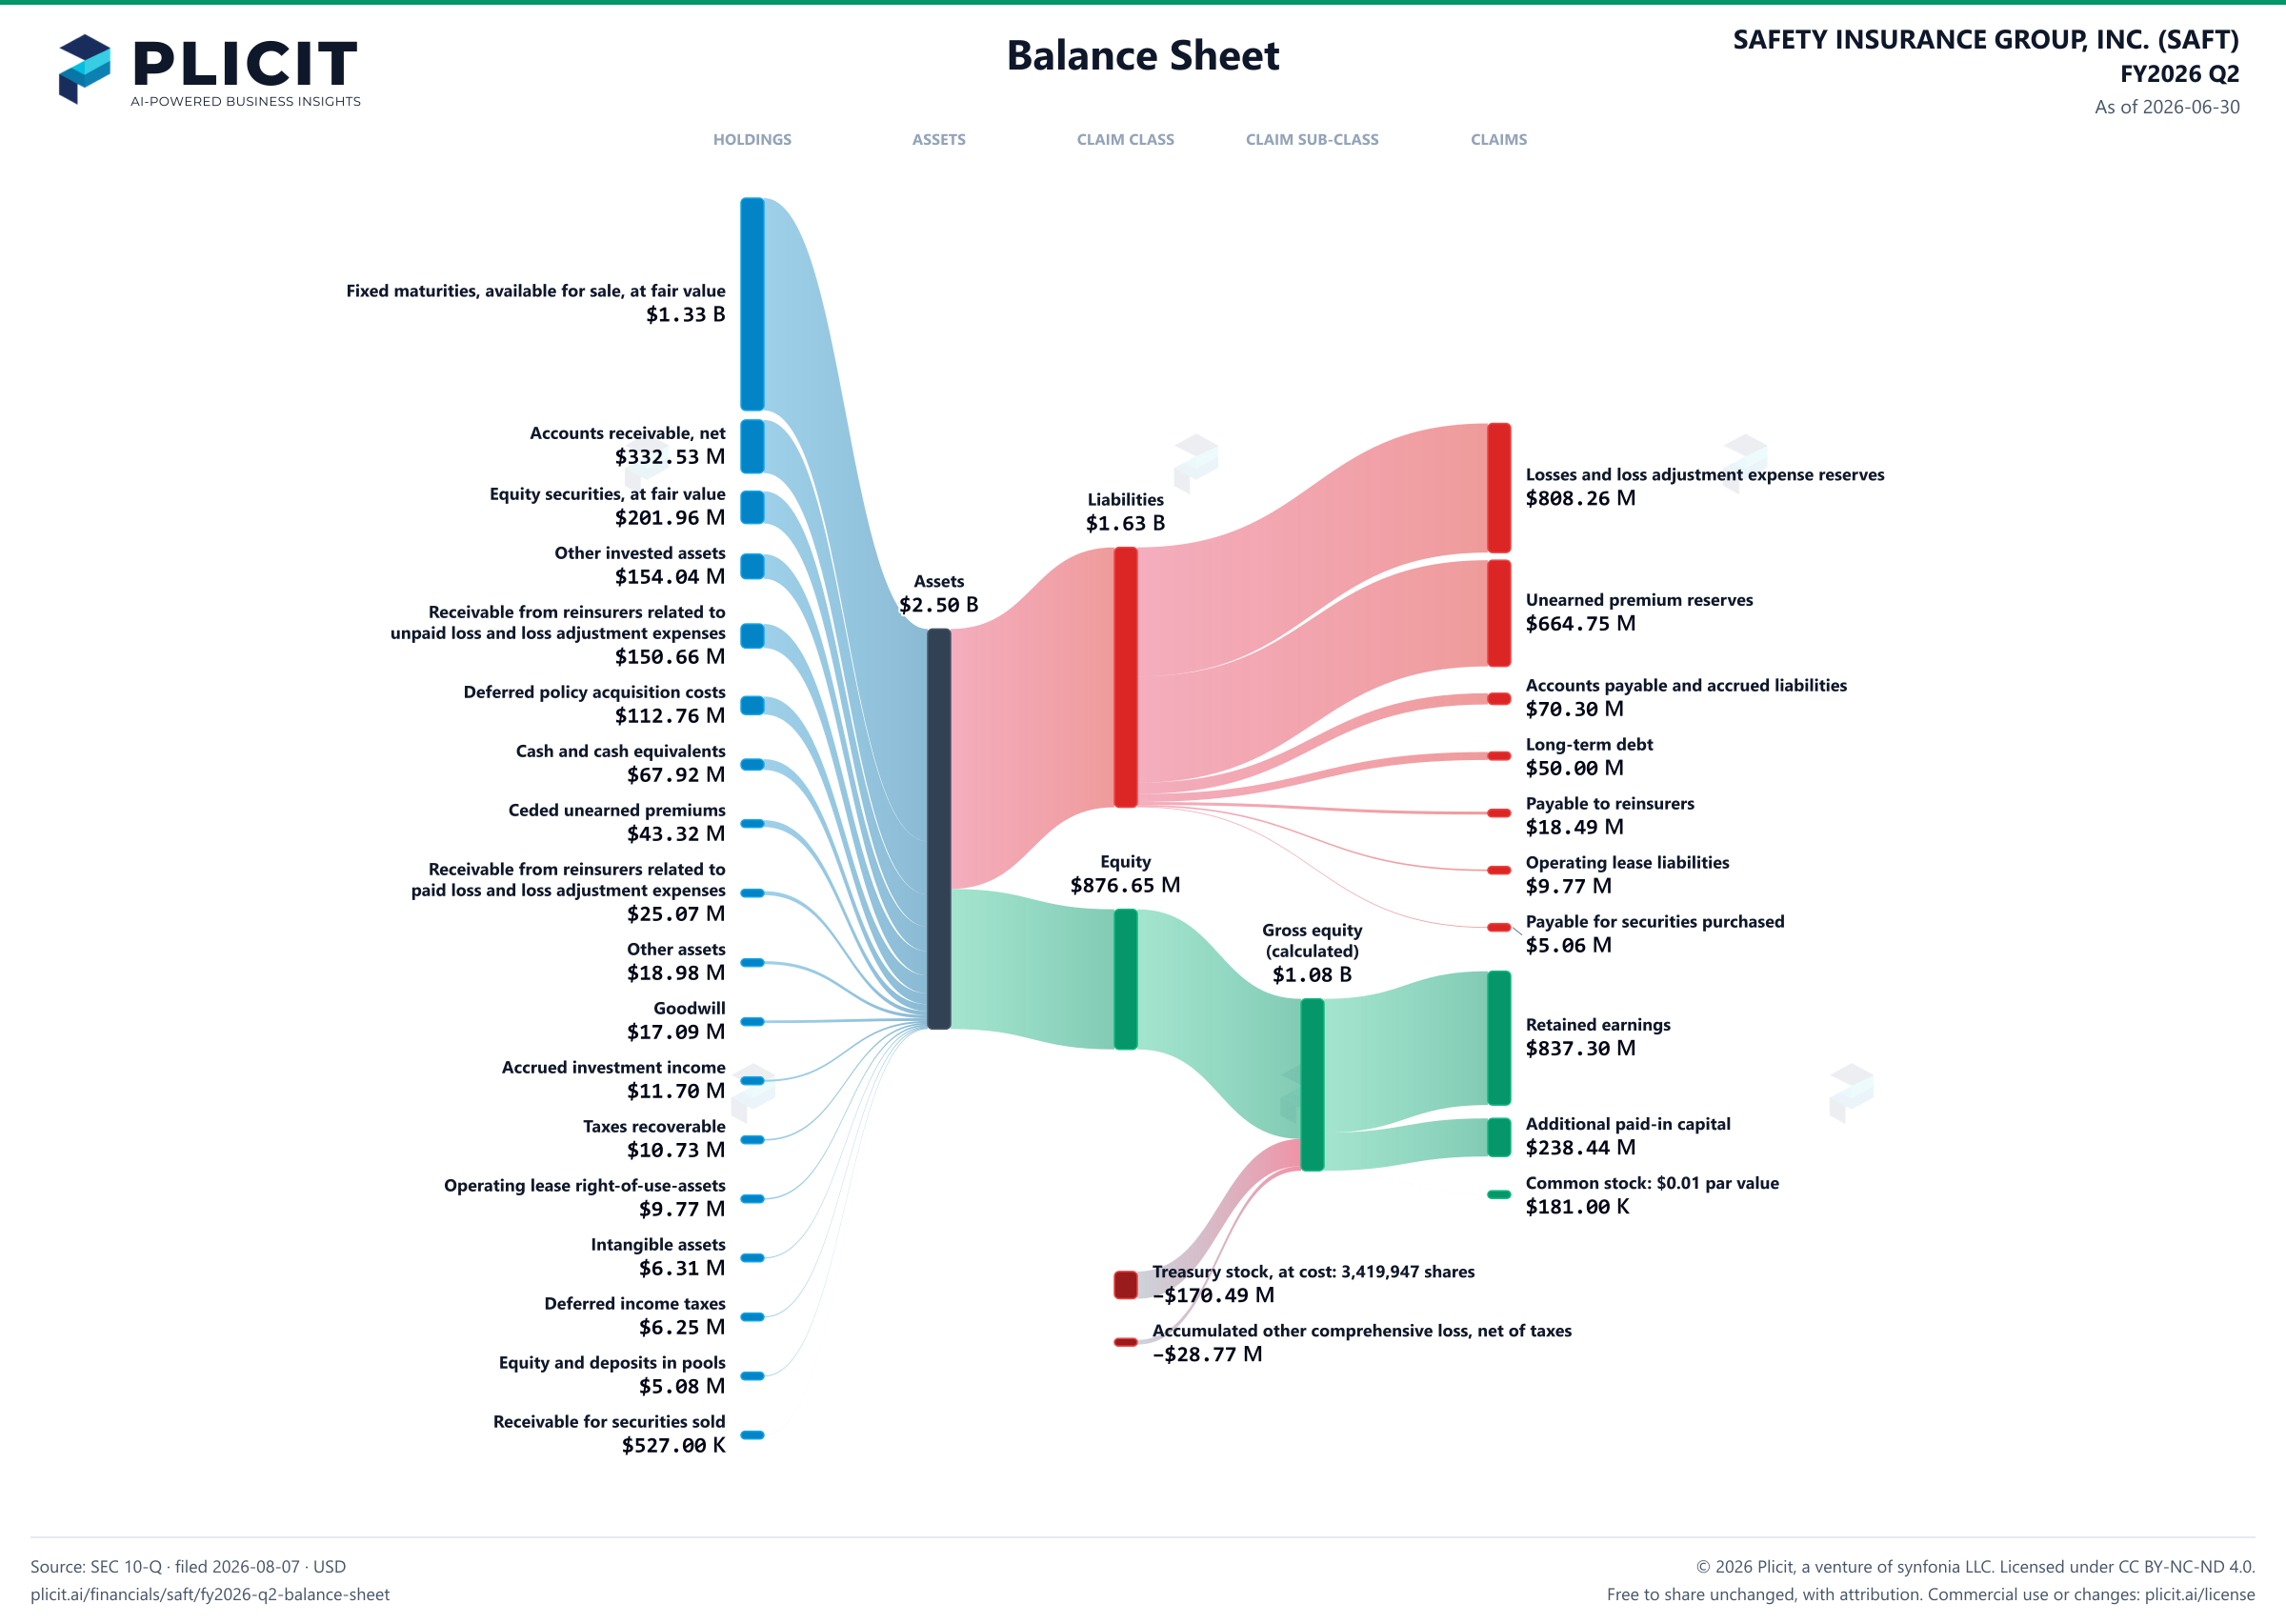
Free to share unchanged, with credit to Plicit.ai · CC BY-NC-ND 4.0Download PNG
Product waitlist
Health Check and Teardown for your own company
A health check uncovers insights of your private books, not a public ticker. Join this list to get notified as soon as we go-live!