
SailPoint, Inc. (SAIL) FY2027 Q2 Balance Sheet
As of 2026-07-31
Balance Sheet
As of 2026-07-31
Swipe to see the full flow
Chart details
SailPoint, Inc. (SAIL) FY2027 Q2 Balance Sheet
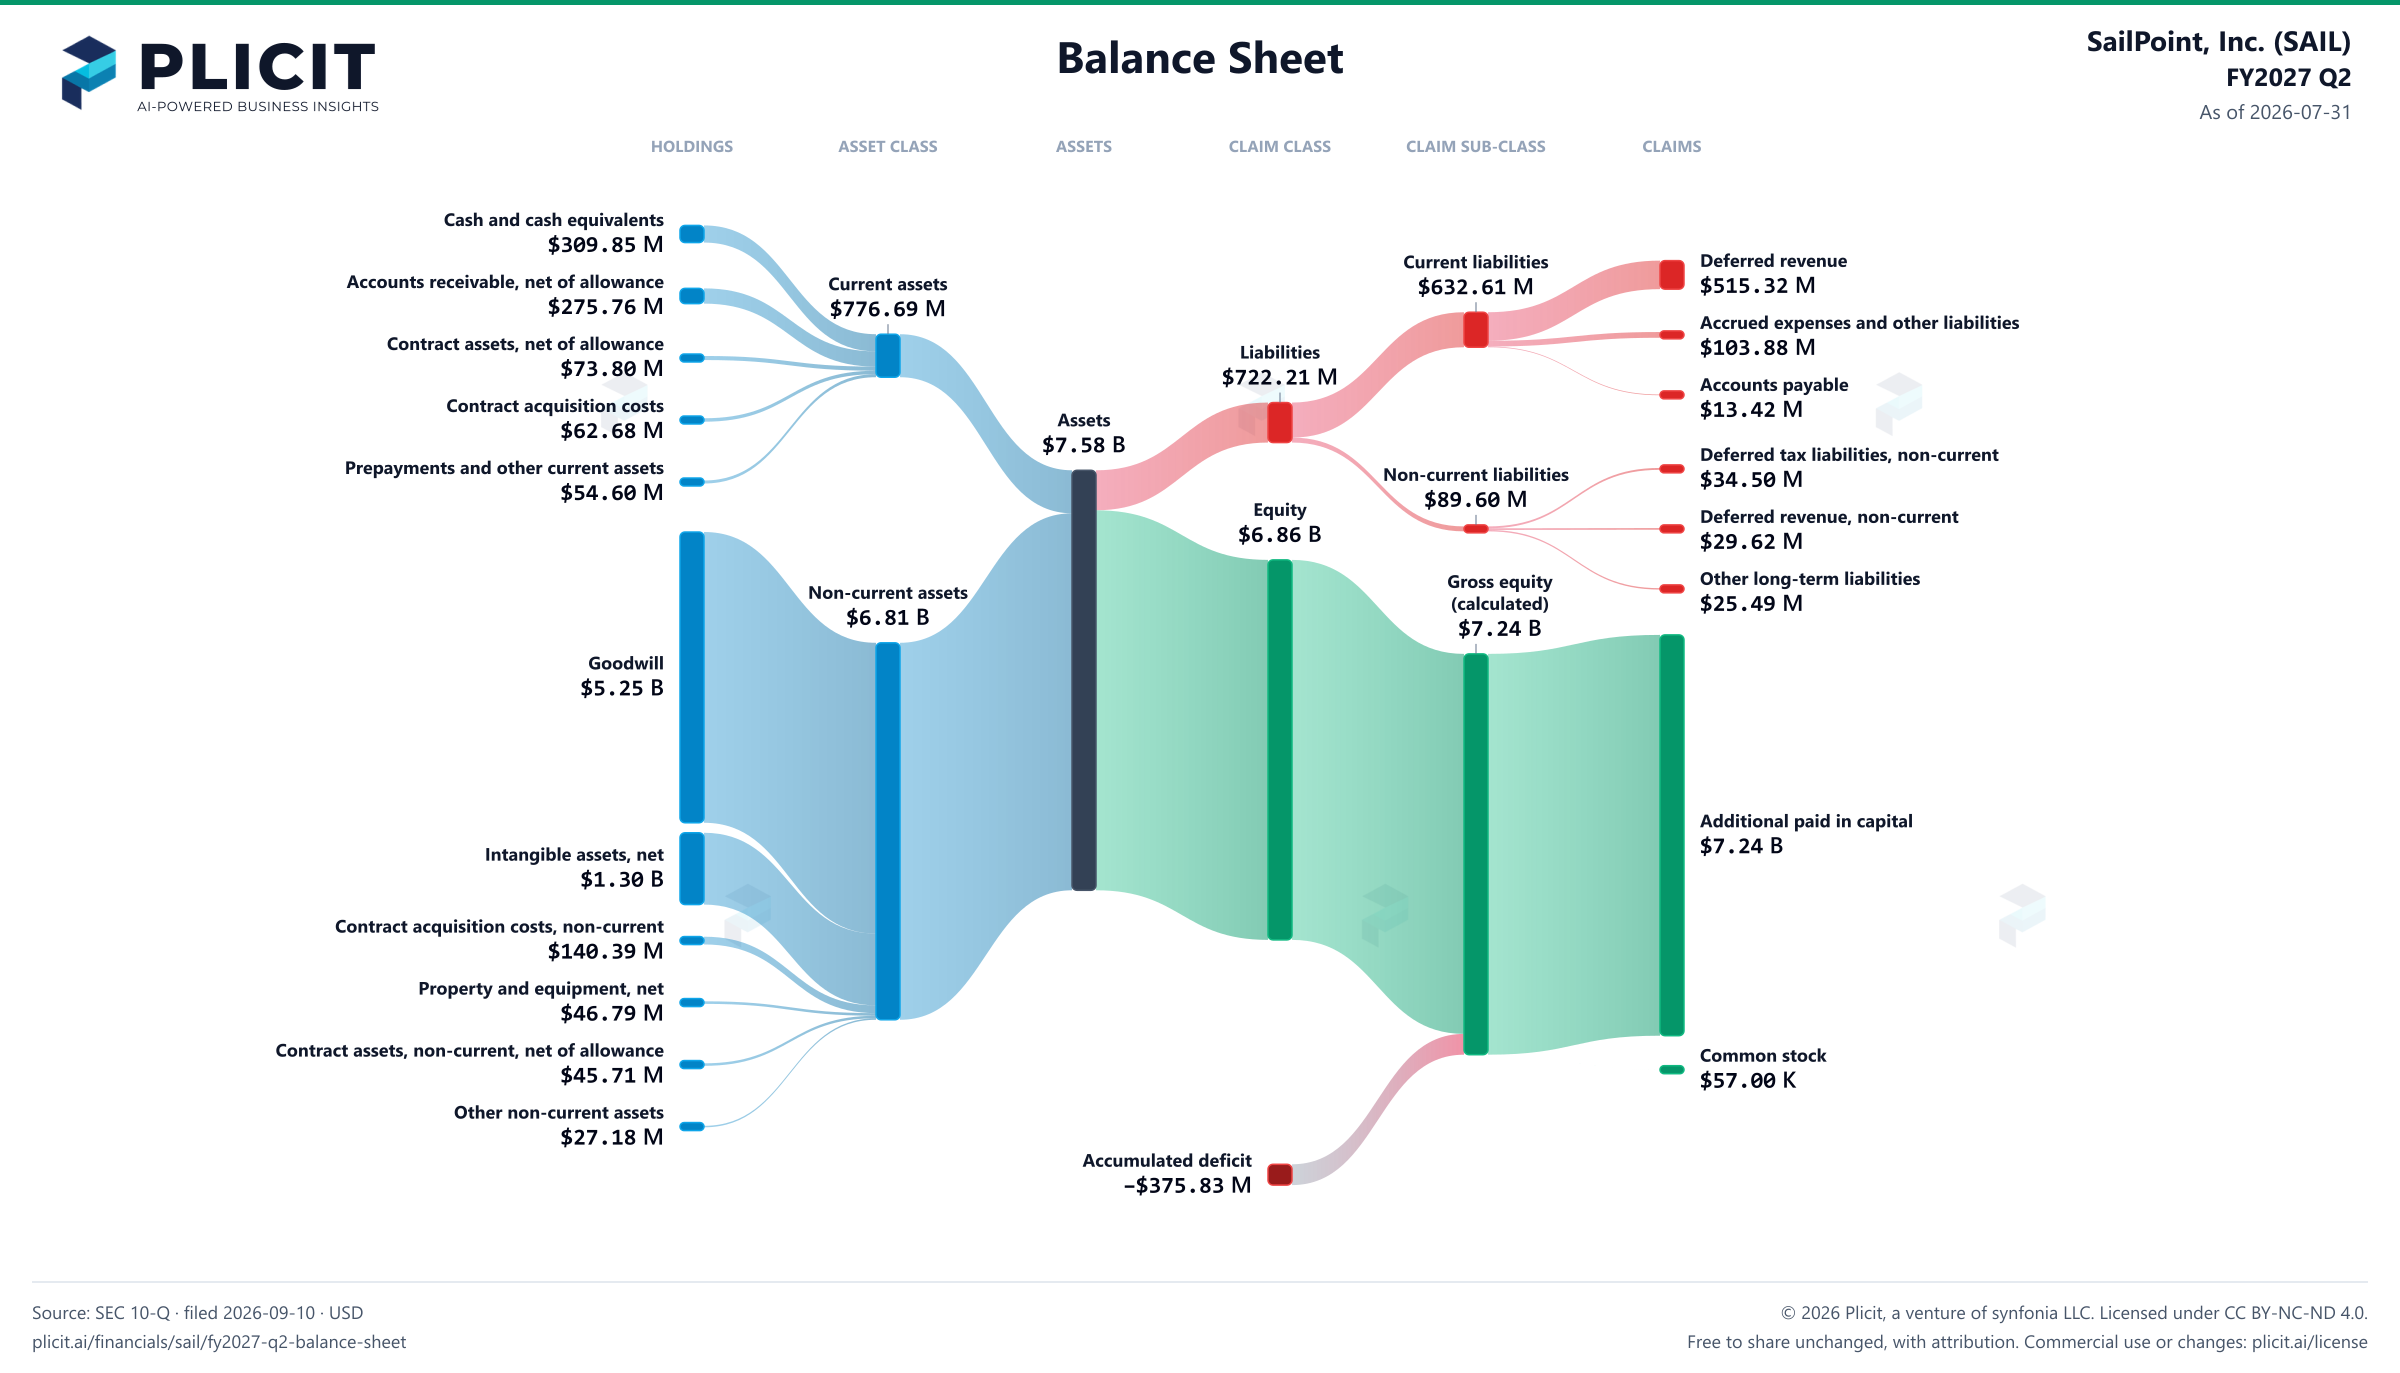
Balance sheet as of 2026-07-31. The chart shows assets, liabilities and equity at that date.
- Assets
- 7,583,822,000 US dollars
- Current assets
- 776,694,000 US dollars
- Non-current assets
- 6,807,128,000 US dollars
- Liabilities
- 722,213,000 US dollars
- Current liabilities
- 632,610,000 US dollars
- Non-current liabilities
- 89,603,000 US dollars
- Equity
- 6,861,609,000 US dollars
- Cash and cash equivalents
- 309,850,000 US dollars
- Accounts receivable, net of allowance
- 275,764,000 US dollars
- Contract assets, net of allowance
- 73,802,000 US dollars
- Contract acquisition costs
- 62,683,000 US dollars
- Prepayments and other current assets
- 54,595,000 US dollars
- Goodwill
- 5,250,334,000 US dollars
- Intangible assets, net
- 1,296,723,000 US dollars
- Contract acquisition costs, non-current
- 140,393,000 US dollars
- Property and equipment, net
- 46,789,000 US dollars
- Contract assets, non-current, net of allowance
- 45,707,000 US dollars
- Other non-current assets
- 27,182,000 US dollars
- Deferred revenue
- 515,319,000 US dollars
- Accrued expenses and other liabilities
- 103,876,000 US dollars
- Accounts payable
- 13,415,000 US dollars
- Deferred tax liabilities, non-current
- 34,503,000 US dollars
- Deferred revenue, non-current
- 29,615,000 US dollars
- Other long-term liabilities
- 25,485,000 US dollars
- Additional paid in capital
- 7,237,385,000 US dollars
- Common stock, par value of $0.0001 per share; 1,750,000,000 shares authorized; 570,907,856 and 563,781,636 shares issued and outstanding as of July 31, 2026 and January 31, 2026, respectively
- 57,000 US dollars
- Preferred stock, par value of $0.0001 per share; 50,000,000 shares authorized; no shares issued or outstanding as of July 31, 2026 and January 31, 2026
- 0 US dollars
- Accumulated deficit
- negative 375,833,000 US dollars
- Gross equity (calculated)
- 7,237,442,000 US dollars. Net equity plus the magnitudes of its negative contributions equals gross positive equity. The negative contributions enter this reconciliation as add-backs; their filed signs stay negative.
Chart connections
- Assets equal liabilities plus consolidated equity. Consolidated equity includes noncontrolling interests when reported.
- Treasury shares and other negative equity contributions reduce equity.
Free to share unchanged, with credit to Plicit.ai · CC BY-NC-ND 4.0Download PNG
Product waitlist
Health Check and Teardown for your own company
A health check uncovers insights of your private books, not a public ticker. Join this list to get notified as soon as we go-live!