
ScanSource, Inc. (SCSC) FY2026 Annual P&L / Income Statement

Revenue by Business Segment by Product and Service

2025-07-01 to 2026-06-30

Swipe to see the full flow
ScanSource, Inc. (SCSC) FY2026 Annual P&L / Income StatementIncome statement for 2025-07-01 through 2026-06-30. View: Segments by Product and Service. Revenue uses this breakdown; costs and expenses retain the consolidated categories.SOURCESREVENUEGROSSOPERATINGPRE-TAXNETSpecialty Technology Solutions - Products and non-recurring servicesIntelisys & Advisory - Recurring RevenueSpecialty Technology Solutions - Recurring RevenueIntelisys & Advisory - Products and non-recurring servicesNet salesGross profitCost of goods soldOperating incomeOperating expenses (calculated)Selling, general and administrative expensesIntangible amortization expenseDepreciation expenseChange in fair value of contingent considerationRestructuring and other chargesOther income (expense), net (calculated)Income before income taxesNet incomeProvision for income taxesOther income (expense), net (calculated)Other income,net (calculated)$5.12 MIncome before income taxesPretax income$103.74 MNet salesNet sales$3.23 BGross profitGross profit$437.36 MOperating incomeOperating income$98.63 MNet incomeNet income$78.87 MOperating expenses (calculated)Operating expenses(calculated)$338.73 MProvision for income taxesProvision forincome taxes$24.87 MCost of goods soldCost of goods sold$2.79 BSelling, general and administrative expensesSelling, general andadministrative expenses$313.18 MSpecialty Technology Solutions - Products and non-recurring servicesSpecialty Technology Solutions -Products and non-recurring services$3.06 BIntangible amortization expenseIntangible amortization expense$16.72 MDepreciation expenseDepreciation expense$5.99 MChange in fair value of contingent considerationChange in fair value ofcontingent consideration$1.07 MIntelisys & Advisory - Recurring RevenueIntelisys & Advisory- Recurring Revenue$96.69 MRestructuring and other chargesRestructuring and other charges$1.77 MSpecialty Technology Solutions - Recurring RevenueSpecialty TechnologySolutions - Recurring Revenue$64.52 MIntelisys & Advisory - Products and non-recurring servicesIntelisys & Advisory - Productsand non-recurring services$4.44 M
Chart details

ScanSource, Inc. (SCSC) FY2026 Annual P&L / Income Statement

Income statement for 2025-07-01 through 2026-06-30. View: Segments by Product and Service. Revenue uses this breakdown; costs and expenses retain the consolidated categories.

Net sales
3,226,062,000 US dollars
Cost of goods sold
2,788,707,000 US dollars
Gross profit
437,355,000 US dollars
Operating expenses (calculated)
338,728,000 US dollars
Operating income
98,627,000 US dollars
Other income (expense), net (calculated)
5,116,000 US dollars
Income before income taxes
103,743,000 US dollars
Provision for income taxes
24,870,000 US dollars
Net income
78,873,000 US dollars
Intelisys & Advisory - Products and non-recurring services
4,436,000 US dollars
Intelisys & Advisory - Recurring Revenue
96,694,000 US dollars
Specialty Technology Solutions - Products and non-recurring services
3,060,417,000 US dollars
Specialty Technology Solutions - Recurring Revenue
64,515,000 US dollars
Selling, general and administrative expenses
313,176,000 US dollars
Depreciation expense
5,992,000 US dollars
Intangible amortization expense
16,721,000 US dollars
Restructuring and other charges
1,766,000 US dollars
Change in fair value of contingent consideration
1,073,000 US dollars

Chart connections

  • Revenue less cost of revenue equals gross profit; gross profit less operating expenses equals operating income.
  • Operating income plus other income or expense equals income before tax. Income before tax less income tax expense or benefit equals net income.
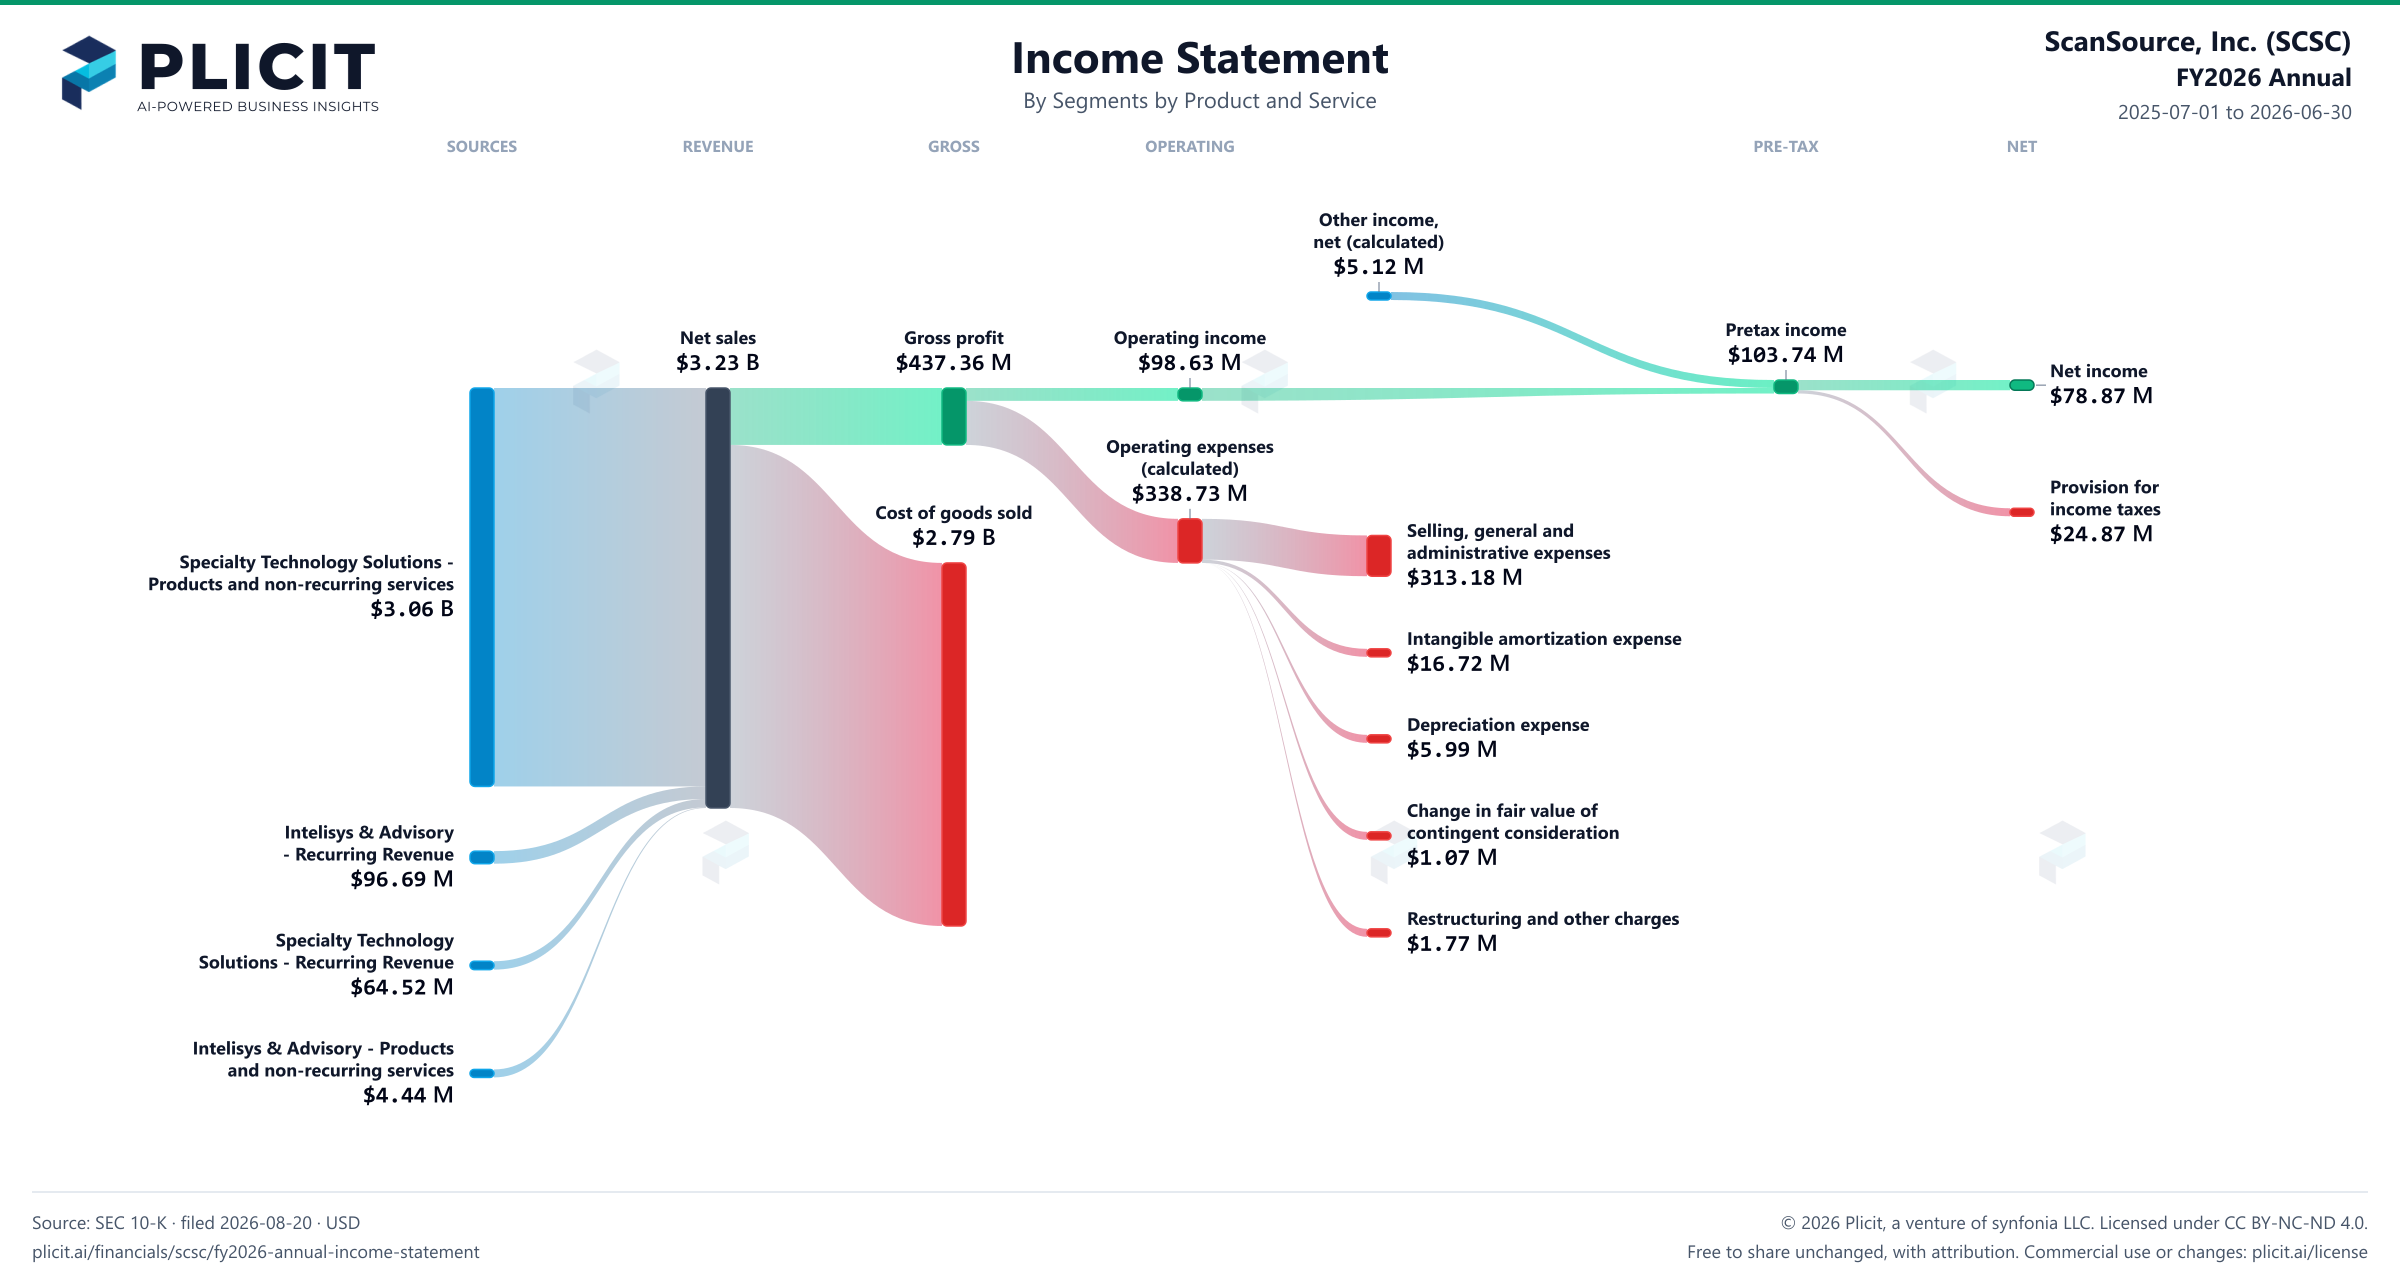
ScanSource, Inc. (SCSC) FY2026 Annual Revenue by Business Segment by Product and Service Sankey chart
Free to share unchanged, with credit to Plicit.ai · CC BY-NC-ND 4.0Download PNG

Gross margin

13.6%

Gross profit / revenue

Operating margin

3.1%

Operating profit / revenue

Cash conversion

156.1%

Operating cash / net income, same period

Newsletter

Get the teardowns by email

Subscribe if you want the public-company teardowns in your inbox when they're released.

Product waitlist

Health Check and Teardown for your own company

A health check uncovers insights of your private books, not a public ticker. Join this list to get notified as soon as we go-live!