
SMITHFIELD FOODS, INC. (SFD) FY2026 Q3 Statement of Cash Flows
Published Source: Form 10-Q on SEC EDGAR filed (opens in a new tab)
Statement of Cash Flows
Swipe to see the full flow
Chart details
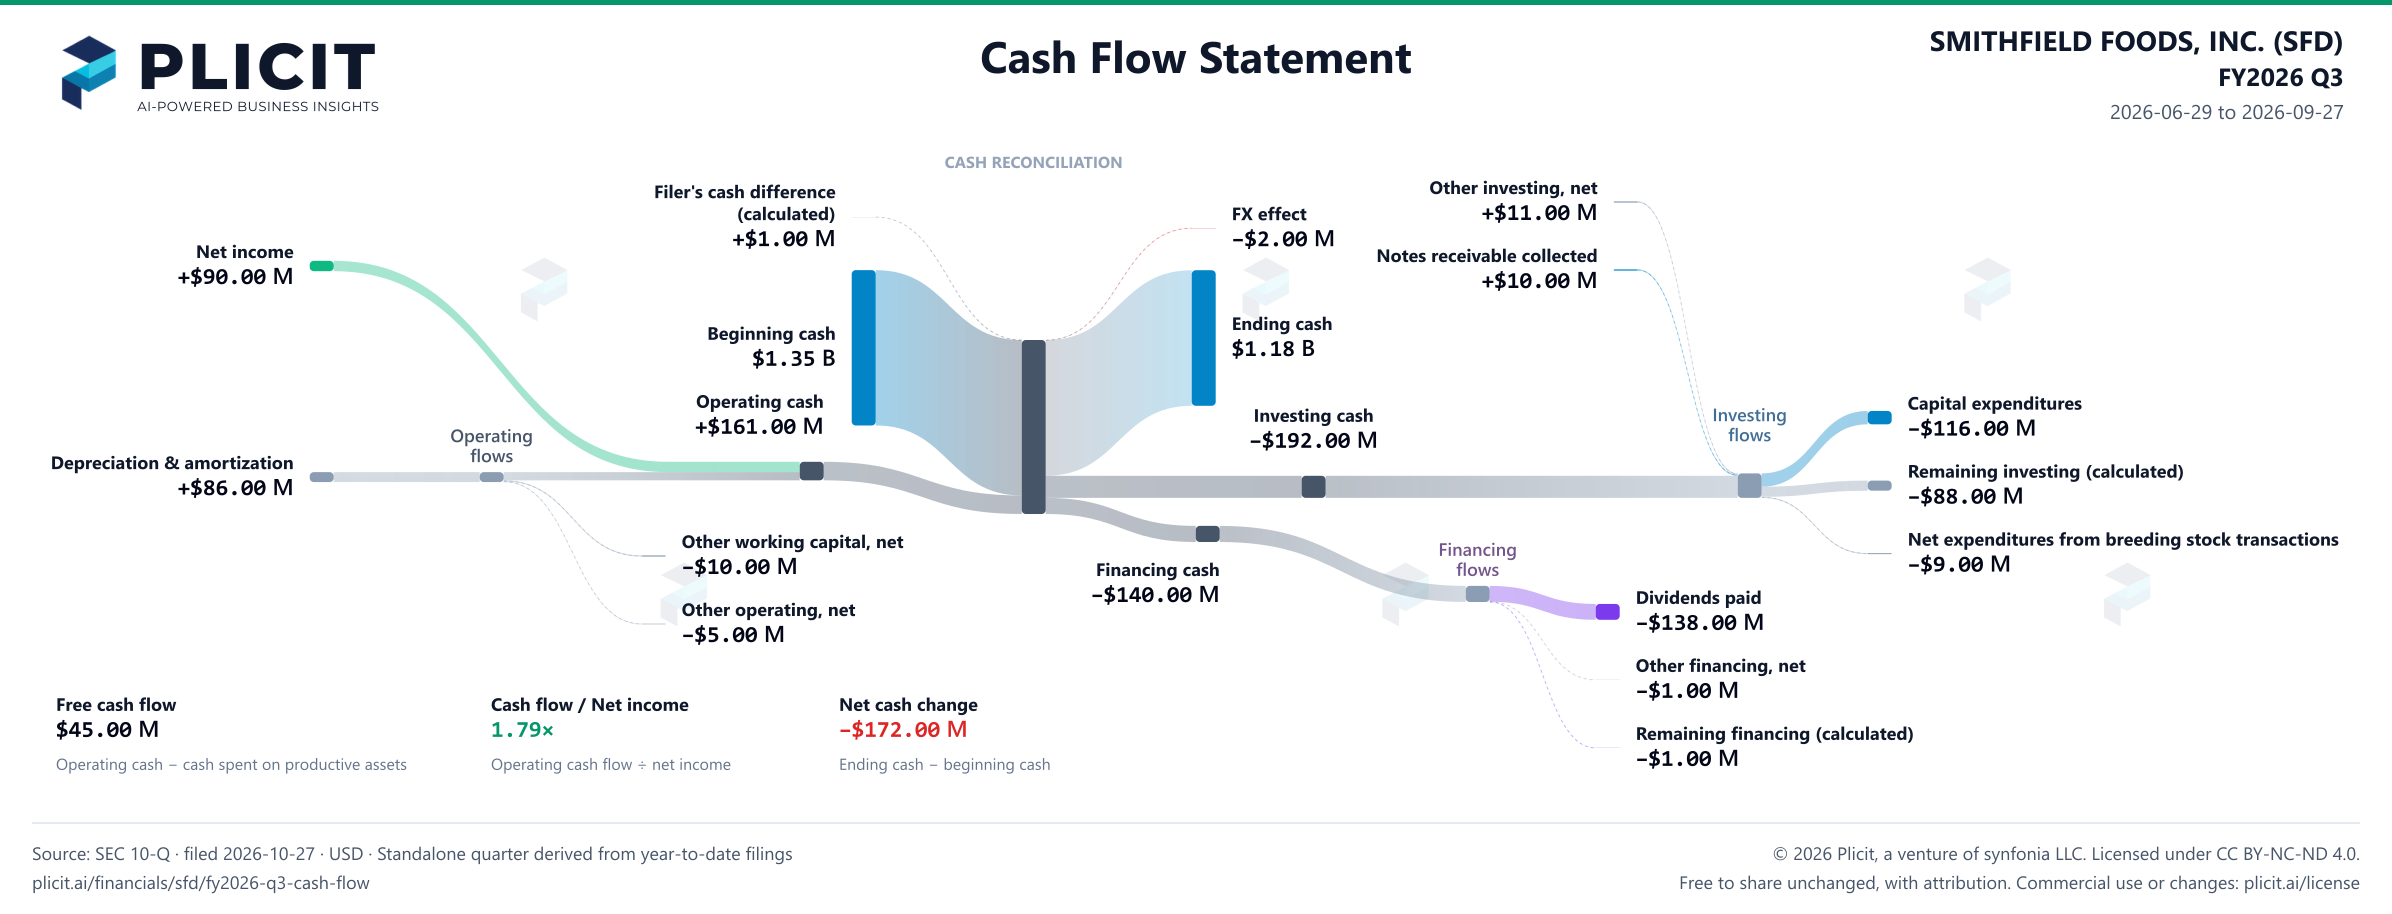
SMITHFIELD FOODS, INC. cash flow reconciliation, Jun 29, 2026 through Sep 27, 2026
Cash flows for Jun 29, 2026 through Sep 27, 2026. Cash basis: Cash, cash equivalents, and restricted cash, including disposal groups and discontinued operations. Beginning cash: Jun 28, 2026. Ending cash: Sep 27, 2026. Beginning and ending cash are dated balances. Positive cash flows add cash; negative cash flows reduce it.
- Beginning cash on Jun 28, 2026
- 1,350,000,000 US dollars. Beginning cash: Cash, cash equivalents, and restricted cash, including disposal groups and discontinued operations
- Operating activities
- 161,000,000 US dollars. Net cash provided.
- Net income
- 90,000,000 US dollars
- Depreciation and amortization
- 86,000,000 US dollars
- Changes in operating and other assets and liabilities, net
- negative 10,000,000 US dollars
- Other
- negative 5,000,000 US dollars
- Investing activities
- negative 192,000,000 US dollars. Net cash used. The remaining amount is calculated by subtracting the other displayed items from the investing total. The filing's tagged investing lines do not add up to the investing total; this is the difference. This quarter is the year to date less the prior quarter's year to date, and the prior quarter's tagged investing lines do not add up to its total. It may combine inflows and outflows.
- Capital expenditures
- negative 116,000,000 US dollars
- Net expenditures from breeding stock transactions
- negative 9,000,000 US dollars
- Cash receipts on notes receivable
- 10,000,000 US dollars
- Other
- 11,000,000 US dollars
- Remaining investing cash flows, net (calculated)
- negative 88,000,000 US dollars
- Financing activities
- negative 140,000,000 US dollars. Net cash used. The remaining amount is calculated by subtracting the other displayed items from the financing total. The filing's tagged financing lines do not add up to the financing total; this is the difference. It may combine inflows and outflows.
- Payment of dividends
- negative 138,000,000 US dollars
- Net proceeds from issuance of common stock
- 0 US dollars
- Other
- negative 1,000,000 US dollars
- Remaining financing cash flows, net (calculated)
- negative 1,000,000 US dollars
- Operating adjustment reconciliation
- 86,000,000 US dollars. Intermediate calculation joining the operating reconciliation branches. Its gross amount includes any portion of net income routed through this junction. It is not an additional cash source or use.
- financing displayed reconciliation
- 140,000,000 US dollars. Intermediate calculation joining the displayed items and the calculated net remainder. It does not establish gross cash receipts or payments and is not an additional cash flow.
- investing displayed reconciliation
- 213,000,000 US dollars. Intermediate calculation joining the displayed items and the calculated net remainder. It does not establish gross cash receipts or payments and is not an additional cash flow.
- Exchange-rate effect
- negative 2,000,000 US dollars
- Difference in the filed cash totals (calculated)
- 1,000,000 US dollars. Into cash; drawn as the small gray flow above beginning cash.
- Ending cash on Sep 27, 2026
- 1,178,000,000 US dollars. Ending cash: Cash, cash equivalents, and restricted cash, including disposal groups and discontinued operations
- Cash sources and uses
- 1,512,000,000 US dollars. Opening cash plus net sources, equal to net uses plus ending cash.
- Net cash change
- negative 172,000,000 US dollars. Ending cash minus beginning cash.
- Cash flow / Net income
- 1.79×. Operating cash flow divided by reconciliation net income for the same period. Black from 0.90× through 1.10×; green above 1.10×; red below 0.90×. Color uses the unrounded ratio.
- Operating cash flow
- 161,000,000 US dollars. Operating cash flow used in the free cash flow calculation.
- cash spent on productive assets
- 116,000,000 US dollars. These cash purchases are already included in investing activities above.
- Free cash flow
- 45,000,000 US dollars. A supplemental measure; finance-lease payments are excluded from this definition.
Chart connections
- Beginning cash plus operating, investing and financing cash flows plus the exchange-rate effect equals ending cash. Negative amounts reduce cash.
- Financing contributions meet at a reconciliation junction before connecting to the net cash total.
- Investing contributions meet at a reconciliation junction before connecting to the net cash total.
- Operating reconciliation adjustments are not all independent cash receipts.
- Net income enters operating cash directly in the reconciliation. The adjustment junction contributes the remaining $71.00M after reconciling the other positive and negative adjustments. These connections depict an accounting reconciliation, not traced cash receipts.
- Each activity has one net cash bar connected to the shared cash pool. Positive activity totals enter the pool; negative activity totals leave the pool to fund that activity's net payments. The central pool does not assign a particular funding source to a particular payment.
- The intermediate calculation bars include both sides of the displayed activity breakdowns; they are not additional cash flows.
- Cash-flow net income is $90.00 M, derived by subtracting the earlier cumulative period; the income statement reports $91.00 M for the same period. The $1.00 M difference is rounding: the filing reports each amount rounded to the nearest million dollars, and the quarter is the difference of two rounded year-to-date amounts. Neither amount has been adjusted.
- The filer's reported cash figures differ by $1.00 M: its ending cash less its beginning cash does not equal its reported net change in cash. The chart shows the difference as its own calculated flow; no reported amount has been adjusted.
- Operating cash flow minus cash spent on productive assets equals free cash flow: 161,000,000 US dollars minus 116,000,000 US dollars equals 45,000,000 US dollars.
- Cash-flow net income is $90.00 M, derived by subtracting the earlier cumulative period; the income statement reports $91.00 M for the same period. The $1.00 M difference is rounding: the filing reports each amount rounded to the nearest million dollars, and the quarter is the difference of two rounded year-to-date amounts. Neither amount has been adjusted.
- The filer's reported cash figures differ by $1.00 M: its ending cash less its beginning cash does not equal its reported net change in cash. The chart shows the difference as its own calculated flow; no reported amount has been adjusted.
Free to share unchanged, with credit to Plicit.ai · CC BY-NC-ND 4.0Download PNG
Product waitlist
Health Check and Teardown for your own company
A health check uncovers insights of your private books, not a public ticker. Join this list to get notified as soon as we go-live!