
Space Exploration Technologies Corp. (SPCX) FY2026 Q3 Balance Sheet
As of 2026-09-30
Balance Sheet
As of 2026-09-30
Swipe to see the full flow
Chart details
Space Exploration Technologies Corp. (SPCX) FY2026 Q3 Balance Sheet
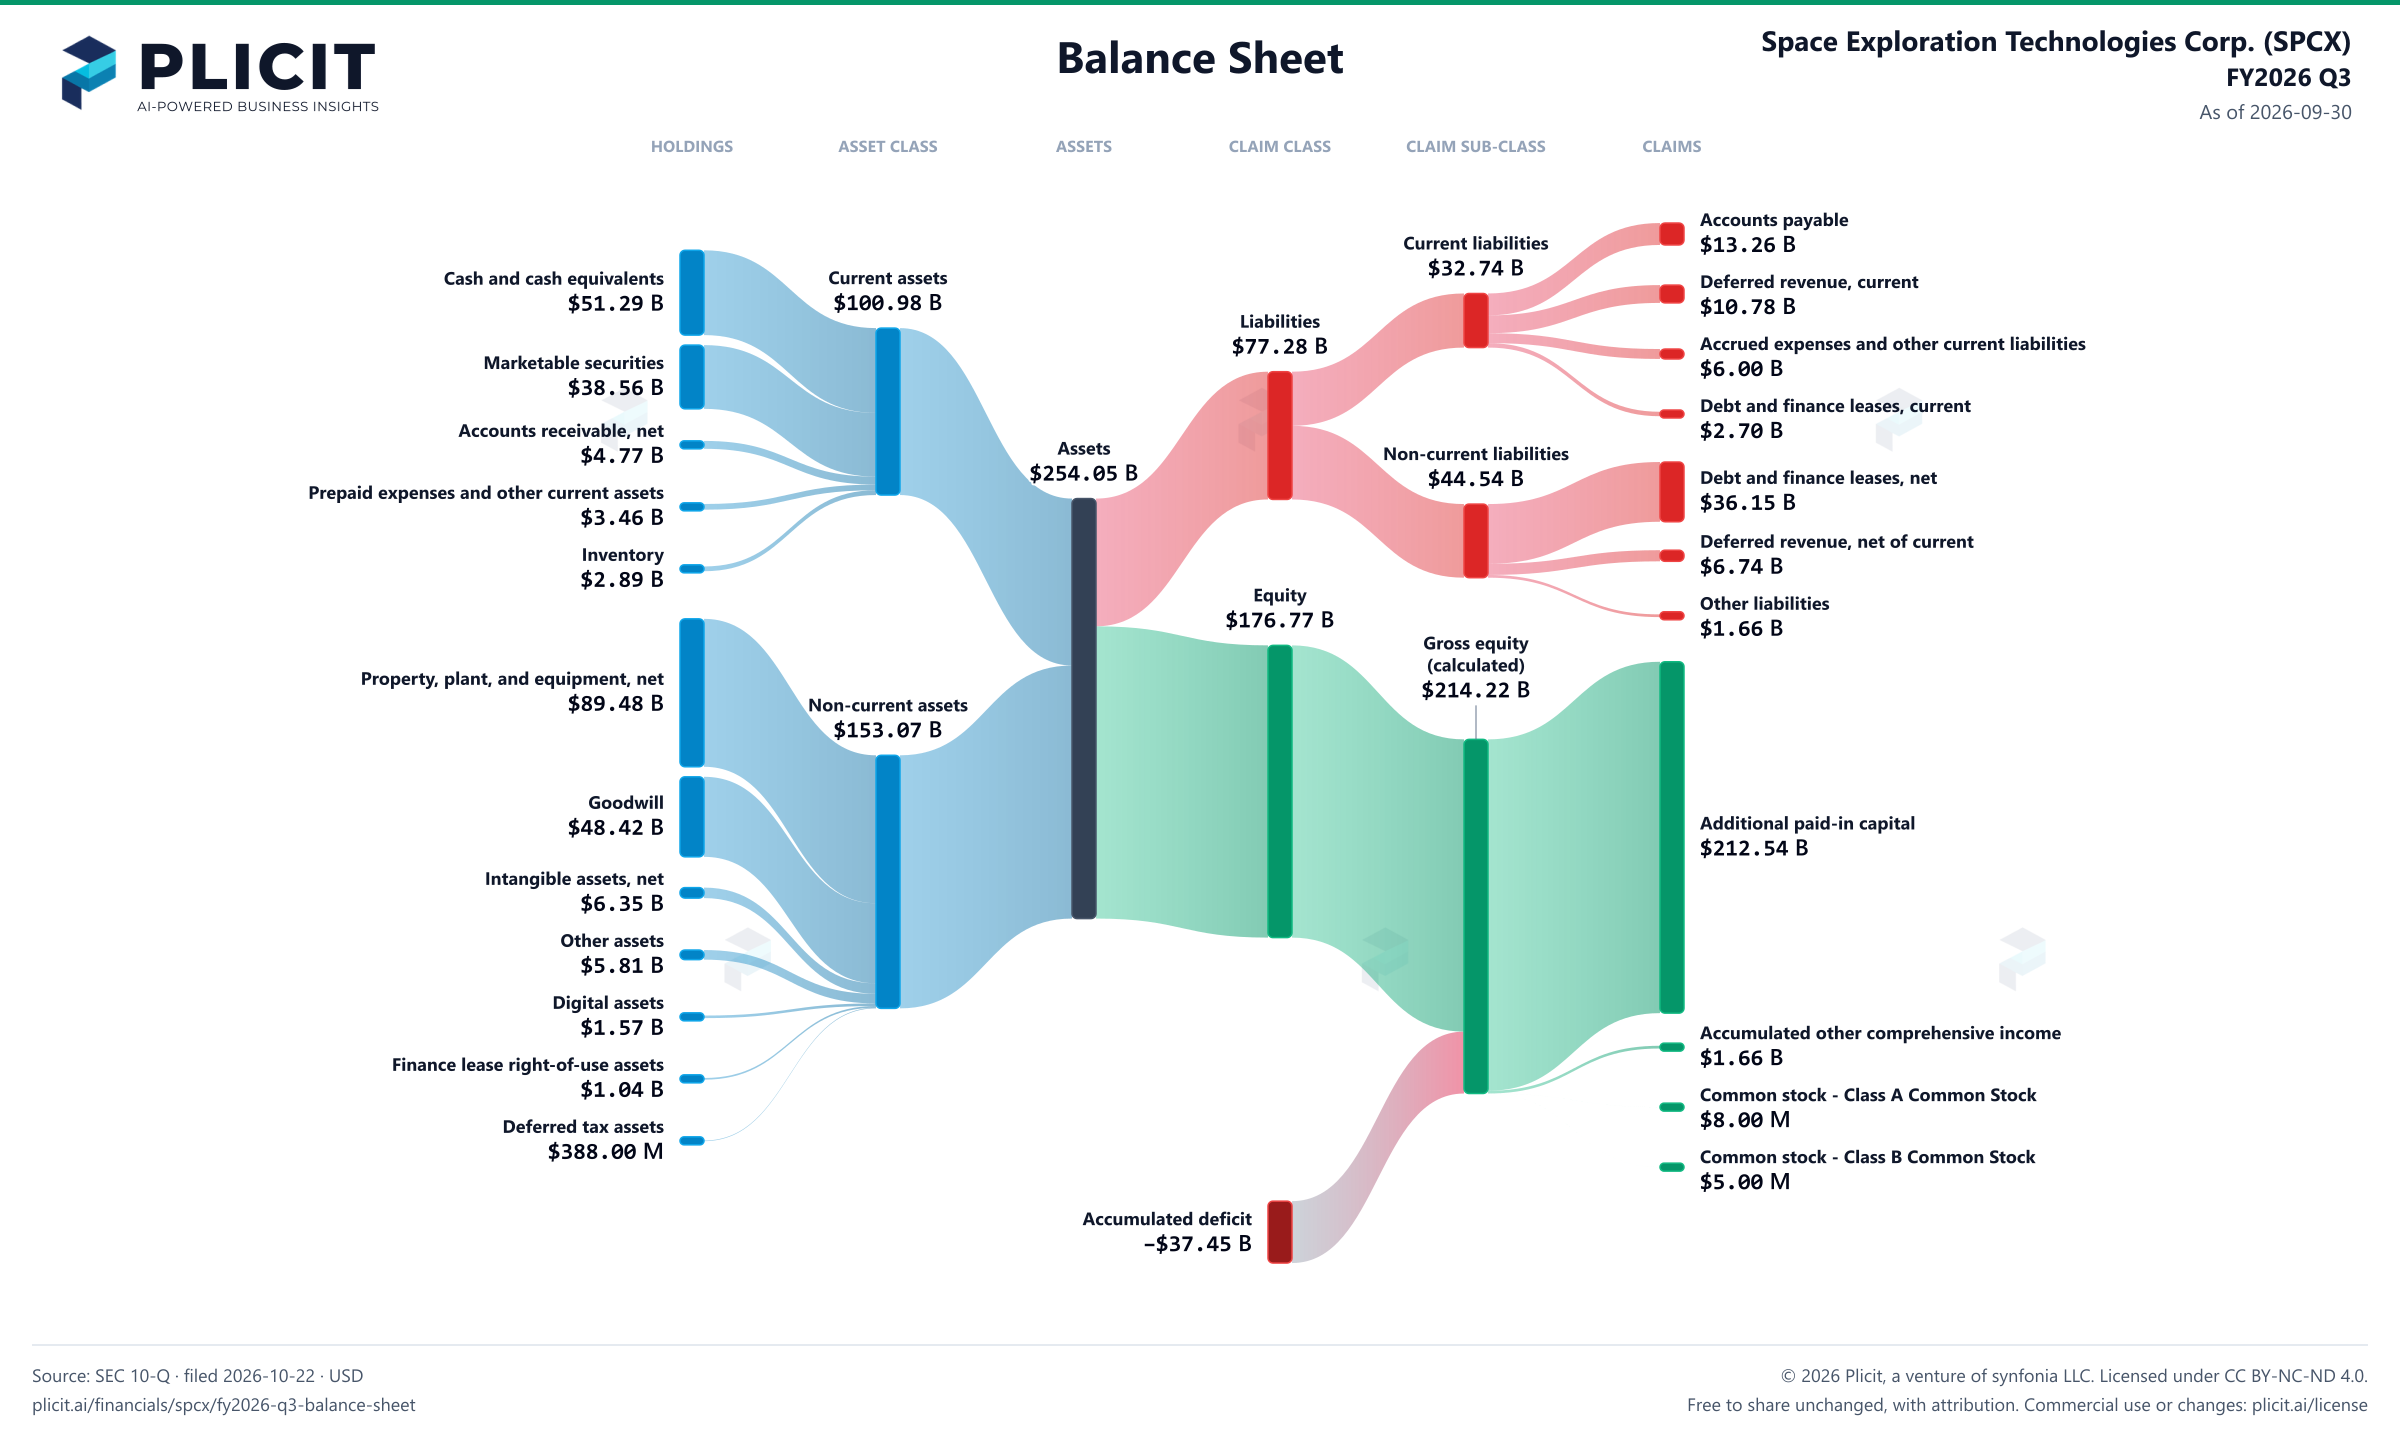
Balance sheet as of 2026-09-30. The chart shows assets, liabilities and equity at that date.
- Assets
- 254,045,000,000 US dollars
- Current assets
- 100,975,000,000 US dollars
- Non-current assets
- 153,070,000,000 US dollars
- Liabilities
- 77,277,000,000 US dollars
- Current liabilities
- 32,738,000,000 US dollars
- Non-current liabilities
- 44,539,000,000 US dollars
- Equity
- 176,768,000,000 US dollars
- Redeemable convertible preferred stock, par value $0.001; - and 2,351 shares issued; - and 2,046 shares outstanding as of September 30, 2026 and December 31, 2025, respectively
- 0 US dollars
- Cash and cash equivalents
- 51,294,000,000 US dollars
- Marketable securities
- 38,561,000,000 US dollars
- Accounts receivable, net of allowance for credit losses of $67 and $39 at September 30, 2026 and December 31, 2025, respectively
- 4,772,000,000 US dollars
- Prepaid expenses and other current assets
- 3,457,000,000 US dollars
- Inventory
- 2,891,000,000 US dollars
- Property, plant, and equipment, net
- 89,483,000,000 US dollars
- Goodwill
- 48,423,000,000 US dollars
- Intangible assets, net
- 6,354,000,000 US dollars
- Other assets (related party of $570 and $10 at September 30, 2026 and December 31, 2025, respectively)
- 5,809,000,000 US dollars
- Digital assets
- 1,573,000,000 US dollars
- Finance lease right-of-use assets
- 1,040,000,000 US dollars
- Deferred tax assets
- 388,000,000 US dollars
- Accounts payable
- 13,259,000,000 US dollars
- Deferred revenue, current
- 10,784,000,000 US dollars
- Accrued expenses and other current liabilities
- 5,997,000,000 US dollars
- Debt and finance leases, current (related party of $2,181 and $455 at September 30, 2026 and December 31, 2025, respectively)
- 2,698,000,000 US dollars
- Debt and finance leases, net of current (related party of $10,716 and $4,052 at September 30, 2026 and December 31, 2025, respectively)
- 36,146,000,000 US dollars
- Deferred revenue, net of current
- 6,736,000,000 US dollars
- Other liabilities
- 1,657,000,000 US dollars
- Additional paid-in capital
- 212,539,000,000 US dollars
- Accumulated other comprehensive income
- 1,664,000,000 US dollars
- Common stock - Class A Common Stock
- 8,000,000 US dollars
- Common stock - Class B Common Stock
- 5,000,000 US dollars
- Preferred stock, par value $0.001; - shares issued and outstanding as of September 30, 2026 and December 31, 2025, respectively
- 0 US dollars
- Common stock - Class C Common Stock
- 0 US dollars
- Accumulated deficit
- negative 37,448,000,000 US dollars
- Gross equity (calculated)
- 214,216,000,000 US dollars. Net equity plus the magnitudes of its negative contributions equals gross positive equity. The negative contributions enter this reconciliation as add-backs; their filed signs stay negative.
Chart connections
- Assets equal liabilities plus temporary equity plus consolidated equity. Consolidated equity includes noncontrolling interests when reported.
- Treasury shares and other negative equity contributions reduce equity.
Free to share unchanged, with credit to Plicit.ai · CC BY-NC-ND 4.0Download PNG
Product waitlist
Health Check and Teardown for your own company
A health check uncovers insights of your private books, not a public ticker. Join this list to get notified as soon as we go-live!