
S&P Global Inc. (SPGI) FY2025 Q1 Balance Sheet
As of 2025-03-31
Balance Sheet
As of 2025-03-31
Swipe to see the full flow
Chart details
S&P Global Inc. (SPGI) FY2025 Q1 Balance Sheet
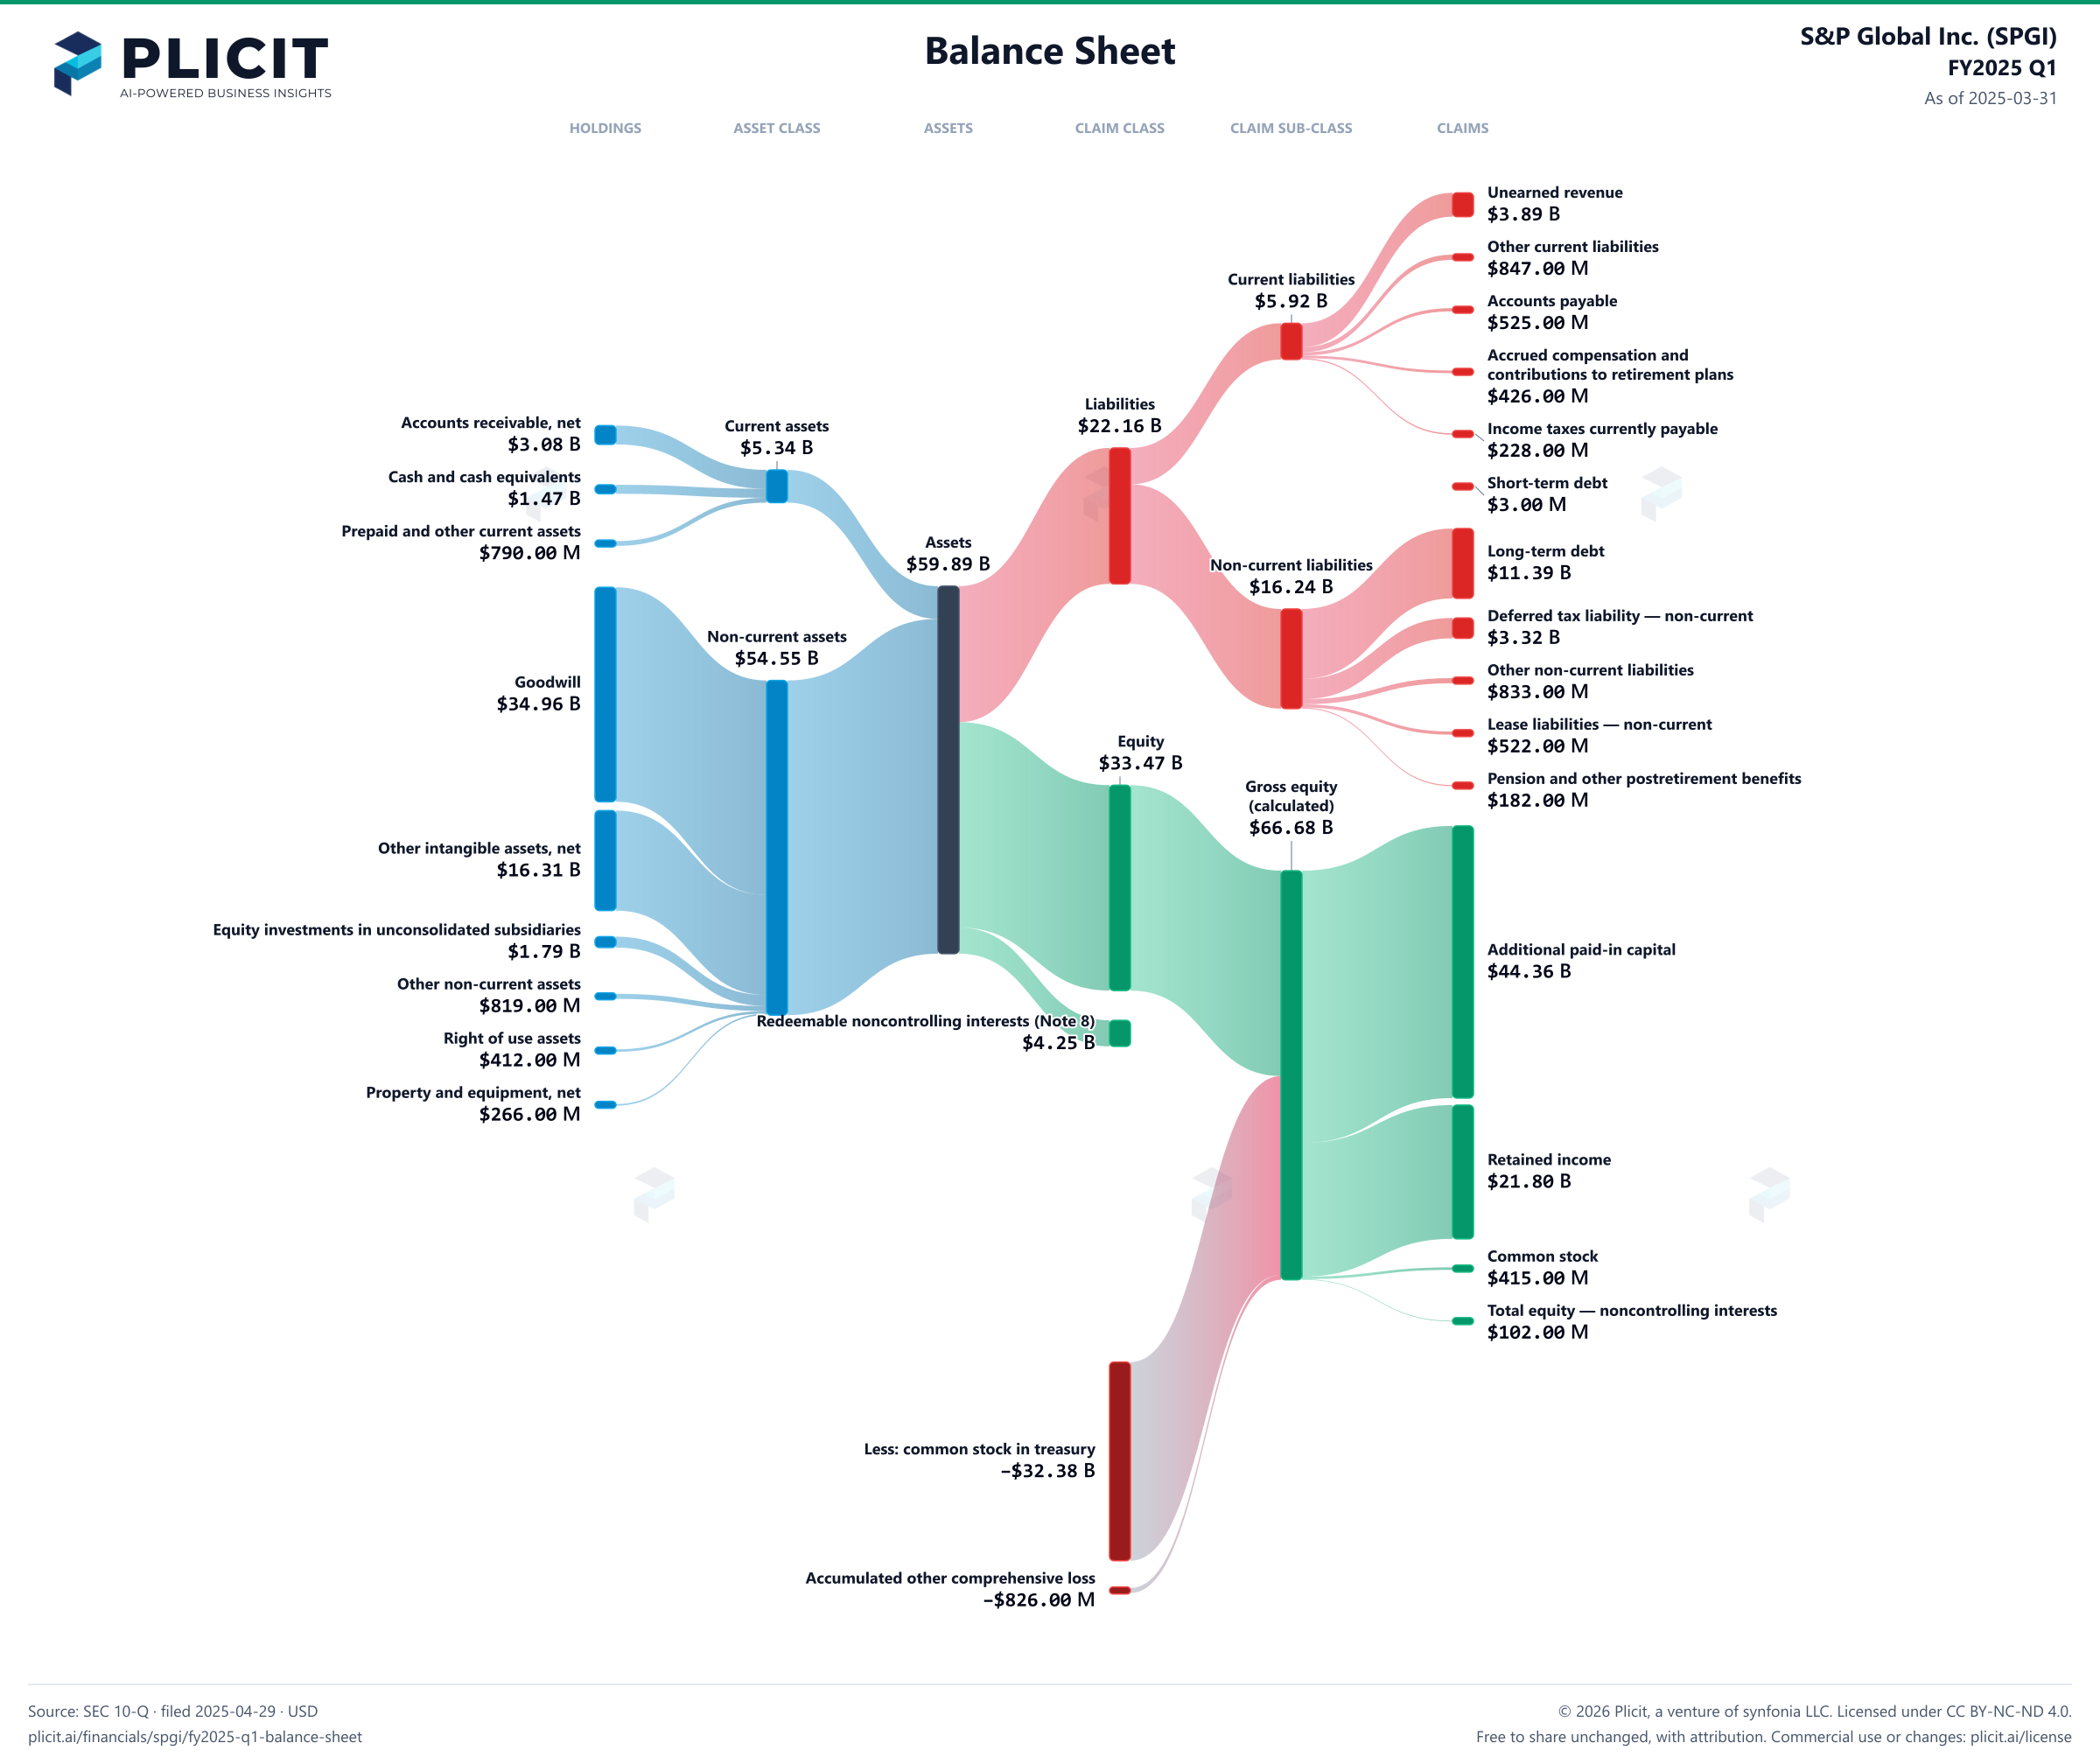
Balance sheet as of 2025-03-31. The chart shows assets, liabilities and equity at that date.
- Assets
- 59,889,000,000 US dollars
- Current assets
- 5,340,000,000 US dollars
- Non-current assets
- 54,549,000,000 US dollars
- Liabilities
- 22,164,000,000 US dollars
- Current liabilities
- 5,920,000,000 US dollars
- Non-current liabilities
- 16,244,000,000 US dollars
- Equity
- 33,473,000,000 US dollars
- Redeemable noncontrolling interests (Note 8)
- 4,252,000,000 US dollars
- Noncontrolling interest
- 102,000,000 US dollars. Included in consolidated equity; this amount is not added again.
- Accounts receivable, net of allowance for doubtful accounts: 2025 - $42; 2024 - $44
- 3,081,000,000 US dollars
- Cash and cash equivalents
- 1,469,000,000 US dollars
- Prepaid and other current assets
- 790,000,000 US dollars
- Restricted cash
- 0 US dollars
- Goodwill
- 34,961,000,000 US dollars
- Other intangible assets, net
- 16,306,000,000 US dollars
- Equity investments in unconsolidated subsidiaries
- 1,785,000,000 US dollars
- Other non-current assets
- 819,000,000 US dollars
- Right of use assets
- 412,000,000 US dollars
- Property and equipment, net of accumulated depreciation: 2025 - $820; 2024 - $823
- 266,000,000 US dollars
- Unearned revenue
- 3,891,000,000 US dollars
- Other current liabilities
- 847,000,000 US dollars
- Accounts payable
- 525,000,000 US dollars
- Accrued compensation and contributions to retirement plans
- 426,000,000 US dollars
- Income taxes currently payable
- 228,000,000 US dollars
- Short-term debt
- 3,000,000 US dollars
- Long-term debt
- 11,388,000,000 US dollars
- Deferred tax liability — non-current
- 3,319,000,000 US dollars
- Other non-current liabilities
- 833,000,000 US dollars
- Lease liabilities — non-current
- 522,000,000 US dollars
- Pension and other postretirement benefits
- 182,000,000 US dollars
- Additional paid-in capital
- 44,359,000,000 US dollars
- Retained income
- 21,799,000,000 US dollars
- Common stock, $1 par value: authorized - 600 million shares; issued - 2025 and 2024 415 million shares
- 415,000,000 US dollars
- Total equity — noncontrolling interests
- 102,000,000 US dollars
- Less: common stock in treasury
- negative 32,376,000,000 US dollars
- Accumulated other comprehensive loss
- negative 826,000,000 US dollars
- Gross equity (calculated)
- 66,675,000,000 US dollars. Net equity plus the magnitudes of its negative contributions equals gross positive equity. The negative contributions enter this reconciliation as add-backs; their filed signs stay negative.
Chart connections
- Assets equal liabilities plus temporary equity plus consolidated equity. Consolidated equity includes noncontrolling interests when reported.
- Treasury shares and other negative equity contributions reduce equity.
Free to share unchanged, with credit to Plicit.ai · CC BY-NC-ND 4.0Download PNG
Product waitlist
Health Check and Teardown for your own company
A health check uncovers insights of your private books, not a public ticker. Join this list to get notified as soon as we go-live!