
SIRIUSPOINT LTD. (SPNT) FY2026 Q2 Balance Sheet

Balance Sheet

As of 2026-06-30

Swipe to see the full flow
SIRIUSPOINT LTD. (SPNT) FY2026 Q2 Balance SheetBalance sheet as of 2026-06-30. The chart shows assets, liabilities and equity at that date.Liabilities$10.38 BAssets$12.65 BEquity$2.28 BGross equity(calculated)$2.30 BHOLDINGSASSETSCLAIM CLASSCLAIM SUB-CLASSCLAIMSDebt securities, available for sale, at fair value, net of allowance for credit losses of $0.0 (2025 - $0.0) (cost - $5,180.5; 2025 - $5,118.3)Insurance and reinsurance balances receivable, netLoss and loss adjustment expenses recoverable, netUnearned premiums cededCash and cash equivalentsDeferred acquisition costs, netOther long-term investments, at fair value (cost - $399.3; 2025 - $421.9) (includes related party investments at fair value of $224.5 (2025 - $216.1))Deferred tax assetOther assetsIntangible assetsRestricted cash and cash equivalentsDebt securities, trading, at fair value (cost - $88.6; 2025 - $114.6)Interest and dividends receivableDue from brokersGoodwillShort-term investments, at fair value (cost - $7.2; 2025 - $28.4)Loss and loss adjustment expense reservesUnearned premium reservesReinsurance balances payableDebtOther liabilitiesDeferred tax liabilityDue to brokersRetained earningsAdditional paid-in capitalCommon shares (issued and outstanding: 116,065,965 (2025 - 116,989,799)Noncontrolling interestsAssetsLiabilitiesEquityGross equity (calculated)Accumulated other comprehensive income (loss), net of taxDebt securities, available for sale, at fair value, net of allowance for credit losses of $0.0 (2025 - $0.0) (cost - $5,180.5; 2025 - $5,118.3)Debt securities, available for sale, at fair value, net$5.16 BLiabilitiesLiabilities$10.38 BInsurance and reinsurance balances receivable, netInsurance and reinsurance balances receivable, net$2.61 BLoss and loss adjustment expense reservesLoss and loss adjustment expense reserves$5.75 BLoss and loss adjustment expenses recoverable, netLoss and loss adjustment expenses recoverable, net$1.99 BAssetsAssets$12.65 BUnearned premiums cededUnearned premiums ceded$630.70 MUnearned premium reservesUnearned premium reserves$2.12 BCash and cash equivalentsCash and cash equivalents$614.80 MReinsurance balances payableReinsurance balances payable$1.46 BDeferred acquisition costs, netDeferred acquisition costs, net$408.70 MDebtDebt$675.50 MOther long-term investments, at fair value (cost - $399.3; 2025 - $421.9) (includes related party investments at fair value of $224.5 (2025 - $216.1))Other long-term investments, at fair value$285.80 MOther liabilitiesOther liabilities$271.80 MDeferred tax assetDeferred tax asset$267.40 MDeferred tax liabilityDeferred tax liability$73.10 MEquityEquity$2.28 BOther assetsOther assets$253.10 MDue to brokersDue to brokers$23.30 MIntangible assetsIntangible assets$137.40 MGross equity (calculated)Gross equity(calculated)$2.30 BRetained earningsRetained earnings$1.40 BRestricted cash and cash equivalentsRestricted cash and cash equivalents$131.10 MAdditional paid-in capitalAdditional paid-in capital$888.90 MDebt securities, trading, at fair value (cost - $88.6; 2025 - $114.6)Debt securities, trading, at fair value$64.80 MCommon shares (issued and outstanding: 116,065,965 (2025 - 116,989,799)Common shares (issued and outstanding: 116,065,965$11.60 MInterest and dividends receivableInterest and dividends receivable$44.20 MNoncontrolling interestsNoncontrolling interests$800.00 KDue from brokersDue from brokers$32.60 MAccumulated other comprehensive income (loss), net of taxAccumulated other comprehensive income (loss), net−$21.30 MGoodwillGoodwill$18.60 MShort-term investments, at fair value (cost - $7.2; 2025 - $28.4)Short-term investments, at fair value$7.50 M
Chart details

SIRIUSPOINT LTD. (SPNT) FY2026 Q2 Balance Sheet

Balance sheet as of 2026-06-30. The chart shows assets, liabilities and equity at that date.

Assets
12,651,700,000 US dollars
Liabilities
10,375,000,000 US dollars
Equity
2,276,700,000 US dollars
Noncontrolling interest
800,000 US dollars. Included in consolidated equity; this amount is not added again.
Debt securities, available for sale, at fair value, net of allowance for credit losses of $0.0 (2025 - $0.0) (cost - $5,180.5; 2025 - $5,118.3)
5,156,900,000 US dollars
Insurance and reinsurance balances receivable, net
2,606,700,000 US dollars
Loss and loss adjustment expenses recoverable, net
1,991,400,000 US dollars
Unearned premiums ceded
630,700,000 US dollars
Cash and cash equivalents
614,800,000 US dollars
Deferred acquisition costs, net
408,700,000 US dollars
Other long-term investments, at fair value (cost - $399.3; 2025 - $421.9) (includes related party investments at fair value of $224.5 (2025 - $216.1))
285,800,000 US dollars
Deferred tax asset
267,400,000 US dollars
Other assets
253,100,000 US dollars
Intangible assets
137,400,000 US dollars
Restricted cash and cash equivalents
131,100,000 US dollars
Debt securities, trading, at fair value (cost - $88.6; 2025 - $114.6)
64,800,000 US dollars
Interest and dividends receivable
44,200,000 US dollars
Due from brokers
32,600,000 US dollars
Goodwill
18,600,000 US dollars
Short-term investments, at fair value (cost - $7.2; 2025 - $28.4)
7,500,000 US dollars
Assets held for sale
0 US dollars
Loss and loss adjustment expense reserves
5,750,300,000 US dollars
Unearned premium reserves
2,119,700,000 US dollars
Reinsurance balances payable
1,461,300,000 US dollars
Debt
675,500,000 US dollars
Other liabilities
271,800,000 US dollars
Deferred tax liability
73,100,000 US dollars
Due to brokers
23,300,000 US dollars
Retained earnings
1,396,700,000 US dollars
Additional paid-in capital
888,900,000 US dollars
Common shares (issued and outstanding: 116,065,965 (2025 - 116,989,799)
11,600,000 US dollars
Series B preference shares (2025 - par value $0.10; authorized and issued: 8,000,000) - Series B preference shares
0 US dollars
Noncontrolling interests
800,000 US dollars
Accumulated other comprehensive income (loss), net of tax
negative 21,300,000 US dollars
Gross equity (calculated)
2,298,000,000 US dollars. Net equity plus the magnitudes of its negative contributions equals gross positive equity. The negative contributions enter this reconciliation as add-backs; their filed signs stay negative.

Chart connections

  • Assets equal liabilities plus consolidated equity. Consolidated equity includes noncontrolling interests when reported.
  • Treasury shares and other negative equity contributions reduce equity.
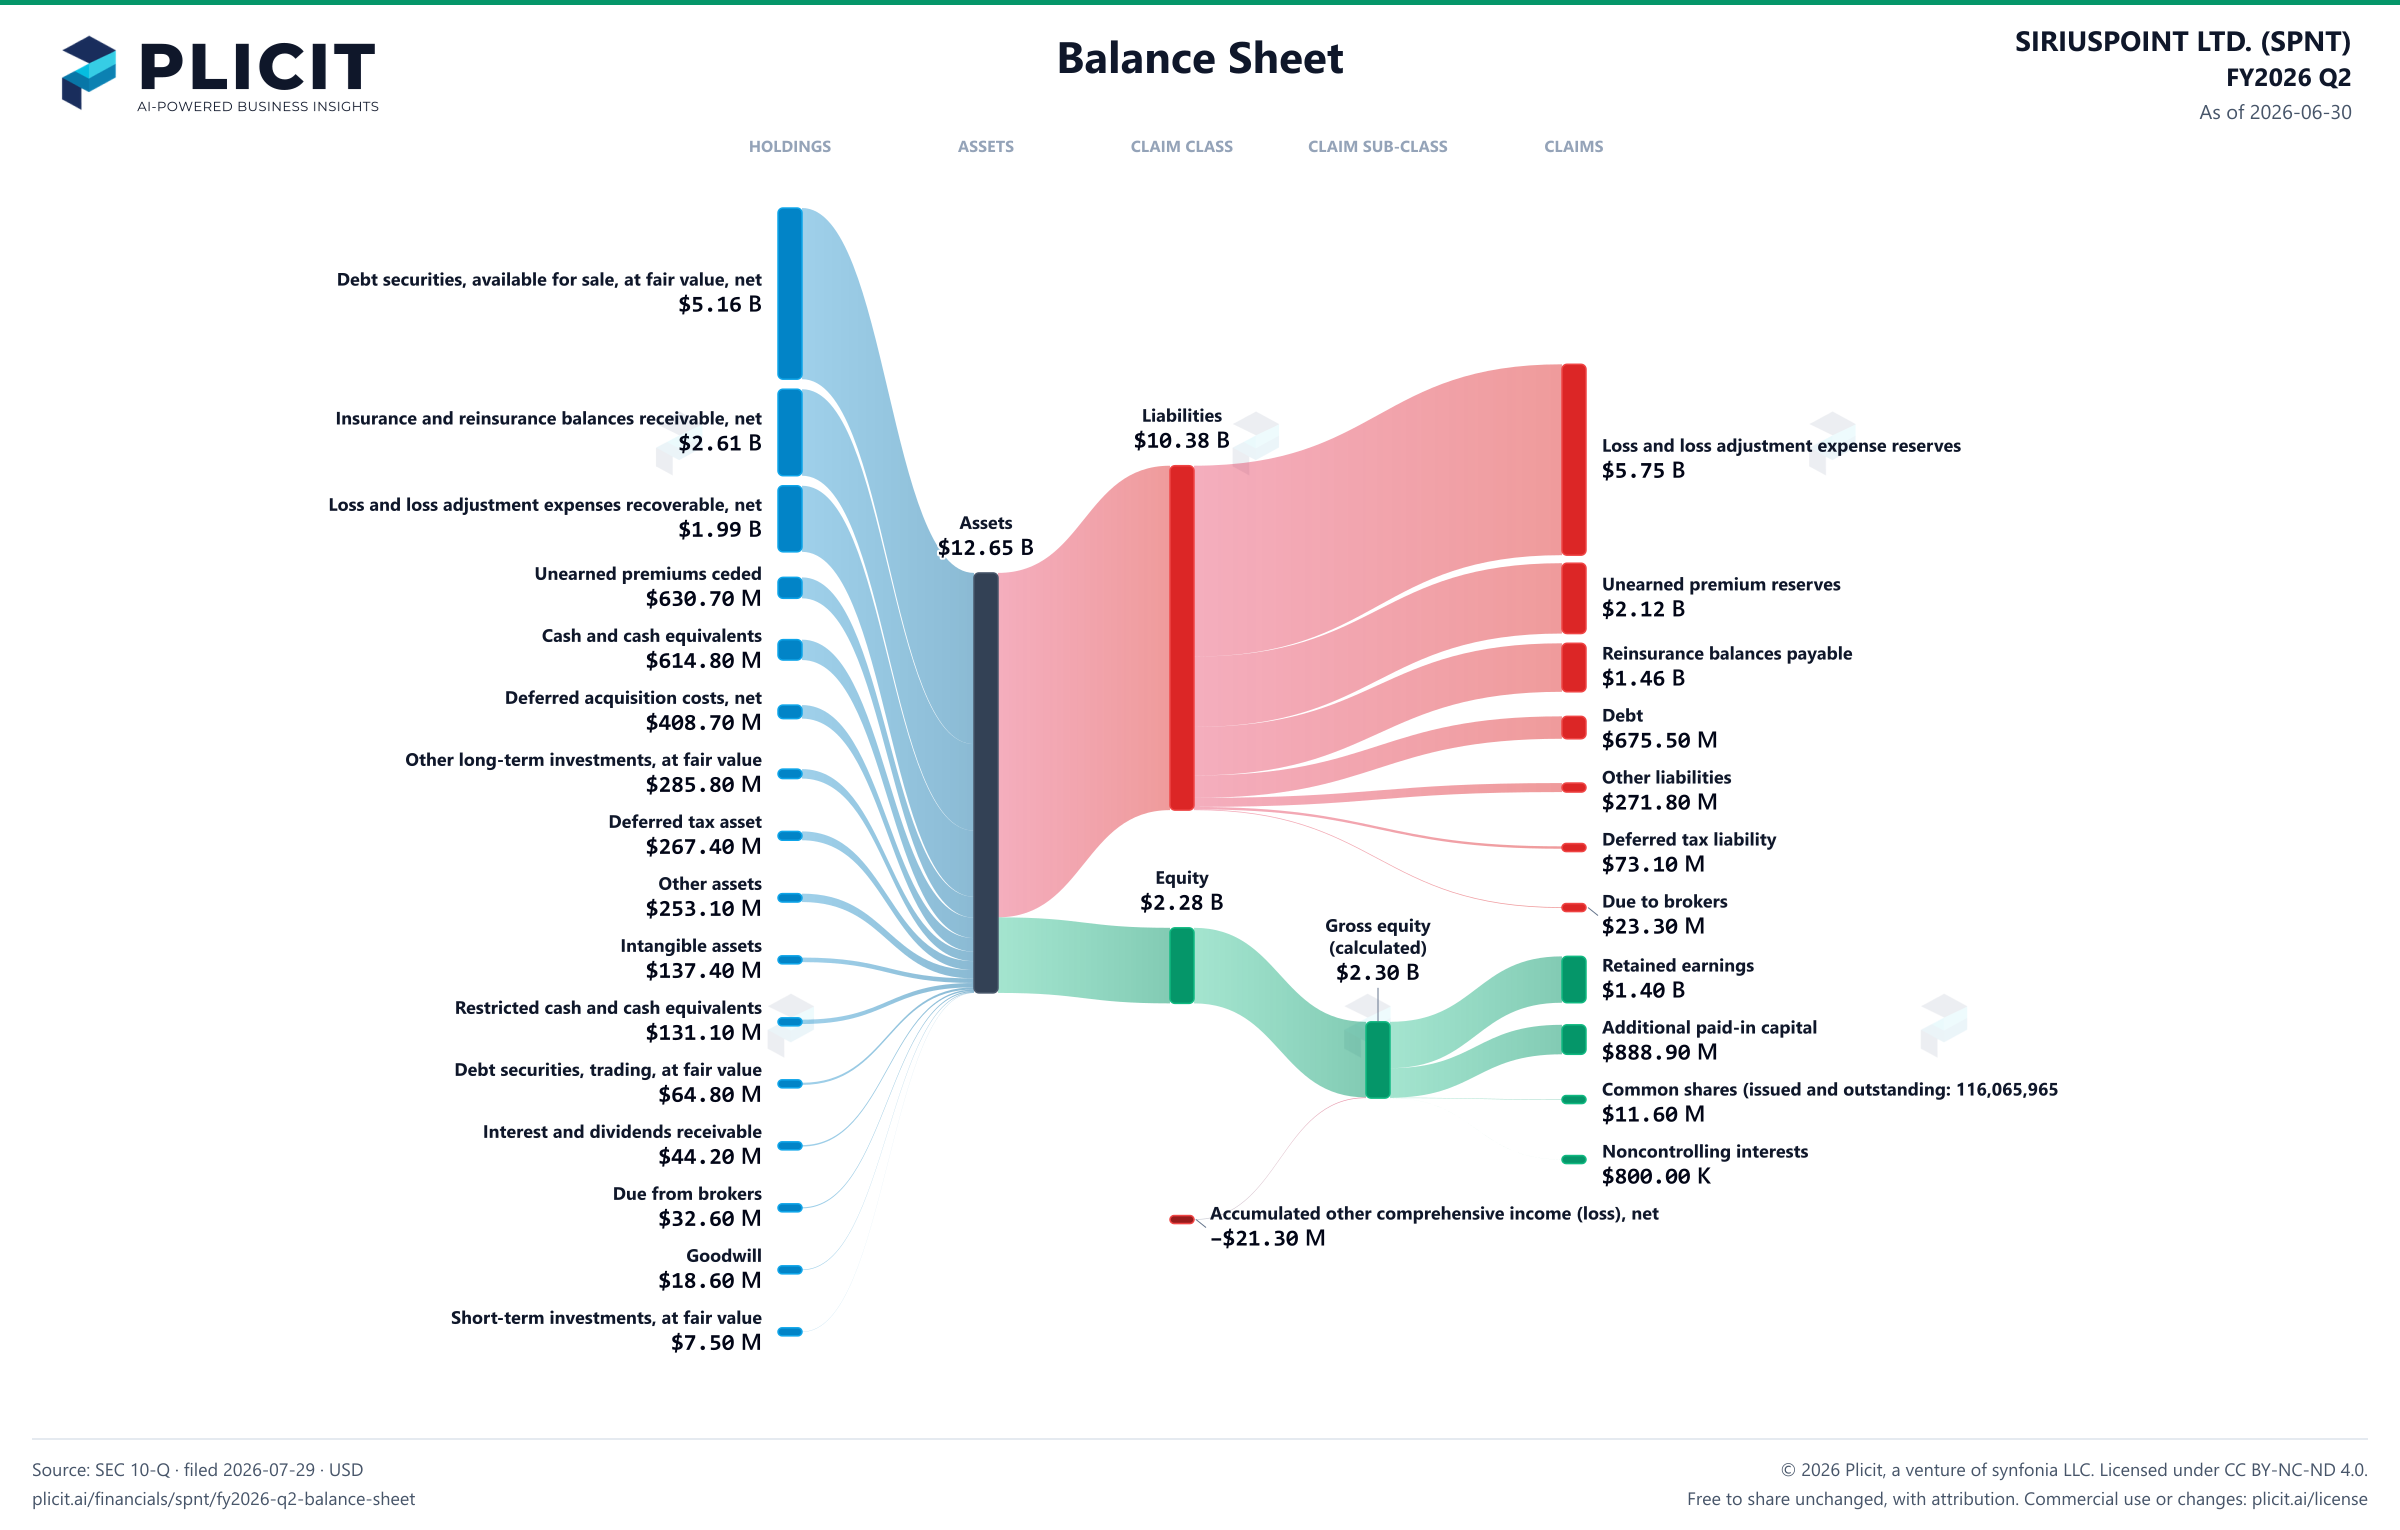
SIRIUSPOINT LTD. (SPNT) FY2026 Q2 Balance Sheet Sankey chart
Free to share unchanged, with credit to Plicit.ai · CC BY-NC-ND 4.0Download PNG

Newsletter

Get the teardowns by email

Subscribe if you want the public-company teardowns in your inbox when they're released.

Product waitlist

Health Check and Teardown for your own company

A health check uncovers insights of your private books, not a public ticker. Join this list to get notified as soon as we go-live!