
SPX TECHNOLOGIES, INC. (SPXC) FY2026 Q2 Balance Sheet

Balance Sheet

As of 2026-06-27

Swipe to see the full flow
SPX TECHNOLOGIES, INC. (SPXC) FY2026 Q2 Balance SheetBalance sheet as of 2026-06-27. The chart shows assets, liabilities and equity at that date.Current liabilities$604.10 MCurrent assets$1.10 BLiabilities(calculated)$1.59 BAssets$3.94 BNon-current liabilities$986.80 MNon-current assets$2.84 BEquity$2.35 BGross equity(calculated)$2.79 BHOLDINGSASSET CLASSASSETSCLAIM CLASSCLAIM SUB-CLASSCLAIMSAccounts receivable, netInventories, netCash and equivalentsContract assetsOther current assetsGoodwillIntangibles, netProperty, plant and equipment, netOther assetsAssets of DBT and Heat Transfer (includes cash and equivalents of $1.8 and $2.0 at June 27, 2026 and December 31, 2025, respectively) (Note 3)Deferred income taxesAccounts payableAccrued expensesContract liabilitiesShort-term debtIncome taxes payableCurrent maturities of long-term debtLong-term debtOther long-term liabilitiesDeferred and other income taxesLiabilities of DBT and Heat Transfer (Note 3)Paid-in capitalRetained earningsAccumulated other comprehensive incomeCommon stock (57,688,145 and 50,080,345 issued and outstanding at June 27, 2026, respectively, and 57,570,062 and 49,866,896 issued and outstanding at December 31, 2025, respectively)Current assetsNon-current assetsAssetsCurrent liabilitiesNon-current liabilitiesLiabilities (calculated)EquityGross equity (calculated)Common stock in treasury (7,607,800 and 7,703,166 shares at June 27, 2026 and December 31, 2025, respectively)Accounts payableAccounts payable$194.60 MAccrued expensesAccrued expenses$183.40 MCurrent liabilitiesCurrent liabilities$604.10 MAccounts receivable, netAccounts receivable, net$442.40 MContract liabilitiesContract liabilities$128.20 MCurrent assetsCurrent assets$1.10 BLiabilities (calculated)Liabilities(calculated)$1.59 BInventories, netInventories, net$374.00 MShort-term debtShort-term debt$74.30 MCash and equivalentsCash and equivalents$166.40 MIncome taxes payableIncome taxes payable$13.70 MAssetsAssets$3.94 BContract assetsContract assets$78.10 MCurrent maturities of long-term debtCurrent maturities of long-term debt$9.90 MOther current assetsOther current assets$41.50 MNon-current liabilitiesNon-current liabilities$986.80 MLong-term debtLong-term debt$530.50 MOther long-term liabilitiesOther long-term liabilities$243.70 MNon-current assetsNon-current assets$2.84 BGoodwillGoodwill$1.23 BEquityEquity$2.35 BDeferred and other income taxesDeferred and other income taxes$198.40 MLiabilities of DBT and Heat Transfer (Note 3)Liabilities of DBT and Heat Transfer (Note 3)$14.20 MGross equity (calculated)Gross equity(calculated)$2.79 BIntangibles, netIntangibles, net$1.02 BProperty, plant and equipment, netProperty, plant and equipment, net$324.80 MPaid-in capitalPaid-in capital$1.93 BOther assetsOther assets$254.10 MAssets of DBT and Heat Transfer (includes cash and equivalents of $1.8 and $2.0 at June 27, 2026 and December 31, 2025, respectively) (Note 3)Assets of DBT and Heat Transfer$5.80 MRetained earningsRetained earnings$621.10 MDeferred income taxesDeferred income taxes$2.60 MAccumulated other comprehensive incomeAccumulated other comprehensive income$232.00 MCommon stock (57,688,145 and 50,080,345 issued and outstanding at June 27, 2026, respectively, and 57,570,062 and 49,866,896 issued and outstanding at December 31, 2025, respectively)Common stock$600.00 KCommon stock in treasury (7,607,800 and 7,703,166 shares at June 27, 2026 and December 31, 2025, respectively)Common stock in treasury−$439.10 M
Chart details

SPX TECHNOLOGIES, INC. (SPXC) FY2026 Q2 Balance Sheet

Balance sheet as of 2026-06-27. The chart shows assets, liabilities and equity at that date.

Assets
3,939,300,000 US dollars
Current assets
1,102,400,000 US dollars
Non-current assets
2,836,900,000 US dollars
Liabilities (calculated)
1,590,900,000 US dollars
Current liabilities
604,100,000 US dollars
Non-current liabilities
986,800,000 US dollars
Equity
2,348,400,000 US dollars
Accumulated depreciation
negative 254,500,000 US dollars. Part of Property, plant and equipment, net, drawn as one net amount.
Machinery and equipment
378,100,000 US dollars. Part of Property, plant and equipment, net, drawn as one net amount.
Land
26,800,000 US dollars. Part of Property, plant and equipment, net, drawn as one net amount.
Buildings and leasehold improvements
174,400,000 US dollars. Part of Property, plant and equipment, net, drawn as one net amount.
Accounts receivable, net
442,400,000 US dollars
Inventories, net
374,000,000 US dollars
Cash and equivalents
166,400,000 US dollars
Contract assets
78,100,000 US dollars
Other current assets
41,500,000 US dollars
Goodwill
1,234,300,000 US dollars
Intangibles, net
1,015,300,000 US dollars
Property, plant and equipment, net
324,800,000 US dollars
Other assets
254,100,000 US dollars
Assets of DBT and Heat Transfer (includes cash and equivalents of $1.8 and $2.0 at June 27, 2026 and December 31, 2025, respectively) (Note 3)
5,800,000 US dollars
Deferred income taxes
2,600,000 US dollars
Accounts payable
194,600,000 US dollars
Accrued expenses
183,400,000 US dollars
Contract liabilities
128,200,000 US dollars
Short-term debt
74,300,000 US dollars
Income taxes payable
13,700,000 US dollars
Current maturities of long-term debt
9,900,000 US dollars
Long-term debt
530,500,000 US dollars
Other long-term liabilities
243,700,000 US dollars
Deferred and other income taxes
198,400,000 US dollars
Liabilities of DBT and Heat Transfer (Note 3)
14,200,000 US dollars
Paid-in capital
1,933,800,000 US dollars
Retained earnings
621,100,000 US dollars
Accumulated other comprehensive income
232,000,000 US dollars
Common stock (57,688,145 and 50,080,345 issued and outstanding at June 27, 2026, respectively, and 57,570,062 and 49,866,896 issued and outstanding at December 31, 2025, respectively)
600,000 US dollars
Common stock in treasury (7,607,800 and 7,703,166 shares at June 27, 2026 and December 31, 2025, respectively)
negative 439,100,000 US dollars
Gross equity (calculated)
2,787,500,000 US dollars. Net equity plus the magnitudes of its negative contributions equals gross positive equity. The negative contributions enter this reconciliation as add-backs; their filed signs stay negative.

Chart connections

  • Assets equal liabilities plus consolidated equity. Consolidated equity includes noncontrolling interests when reported.
  • Treasury shares and other negative equity contributions reduce equity.
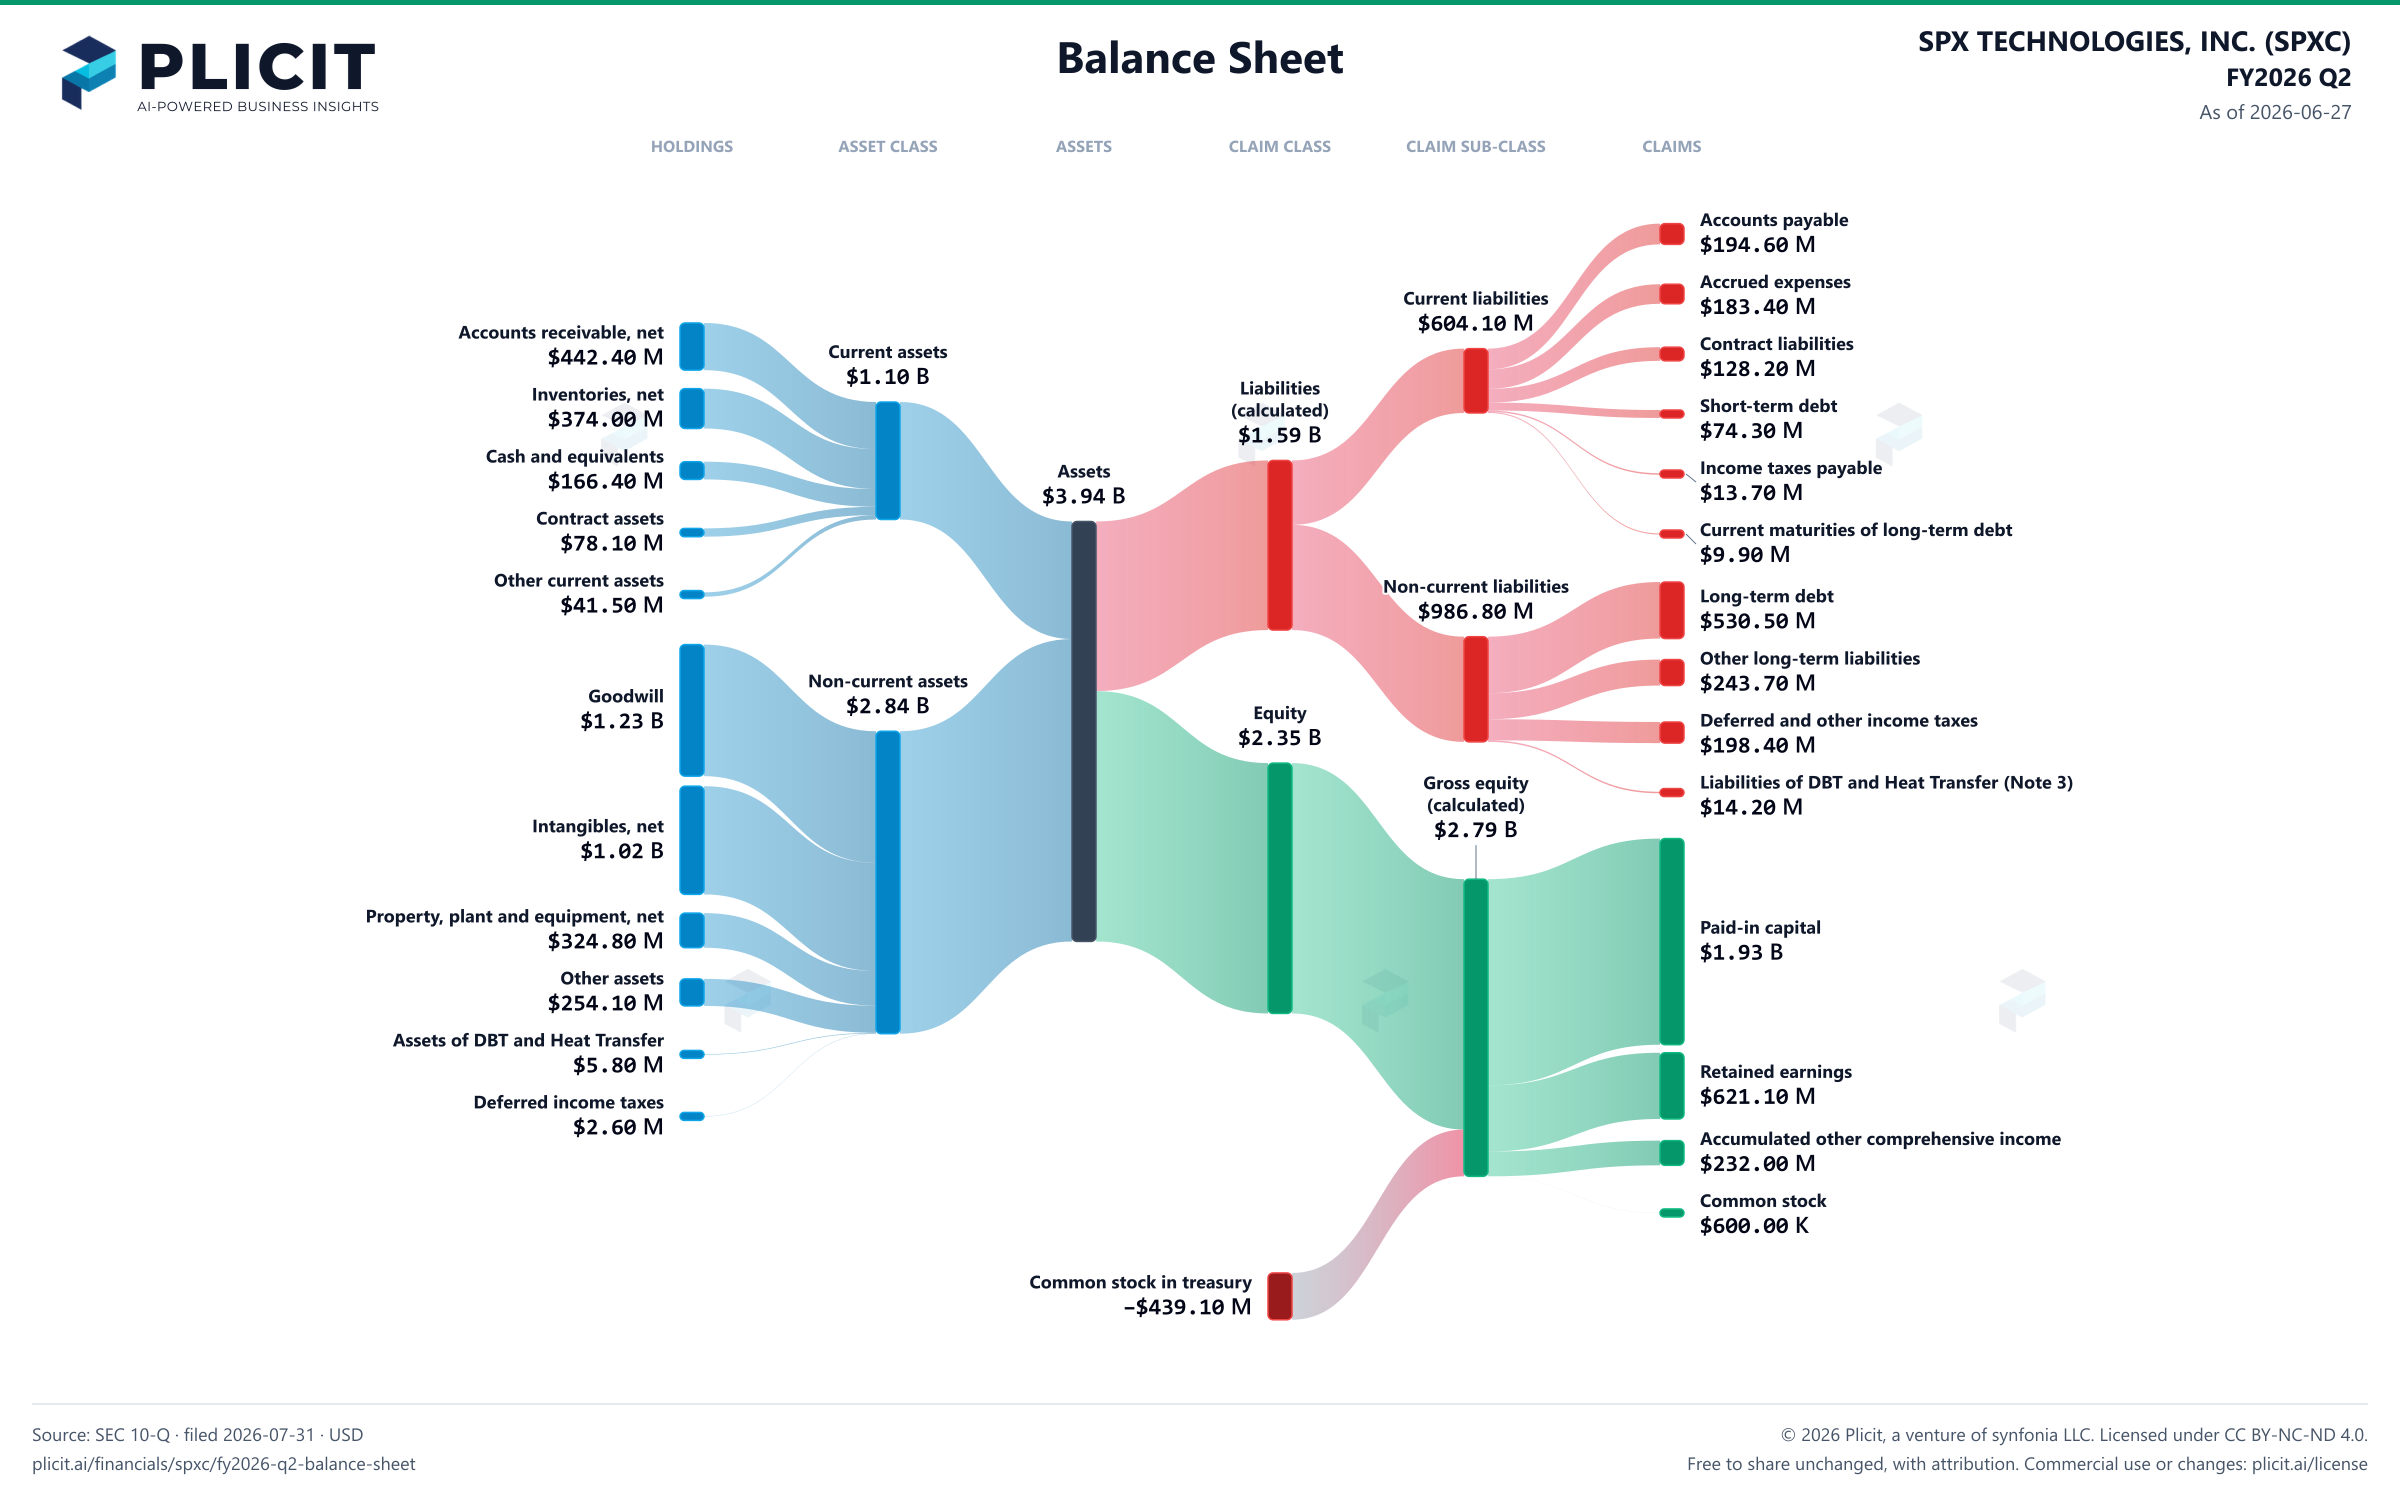
SPX TECHNOLOGIES, INC. (SPXC) FY2026 Q2 Balance Sheet Sankey chart
Free to share unchanged, with credit to Plicit.ai · CC BY-NC-ND 4.0Download PNG

Newsletter

Get the teardowns by email

Subscribe if you want the public-company teardowns in your inbox when they're released.

Product waitlist

Health Check and Teardown for your own company

A health check uncovers insights of your private books, not a public ticker. Join this list to get notified as soon as we go-live!