
Steel Dynamics, Inc. (STLD) FY2026 Q3 P&L / Income Statement

Published · Updated Source: Form 10-Q on SEC EDGAR filed (opens in a new tab)

Key Takeaways

  • Operating income rose 98% to $1.01 B, while sales grew 35% to $6.51 B in the quarter.
  • Profit-sharing expense rose 92% to $81.25 M, far faster than sales grew at 35%.
  • Interest expense jumped 190% to $39.33 M as capitalized interest fell 72%.
  • Income tax rose to 22.8% of pretax profit, up from 21.4% a year earlier.
  • Aluminum sales rose 373% in the quarter, and its operating loss narrowed 54%.

The Unvarnished Truth

Operating profit nearly doubled, and so did the profit-sharing bill

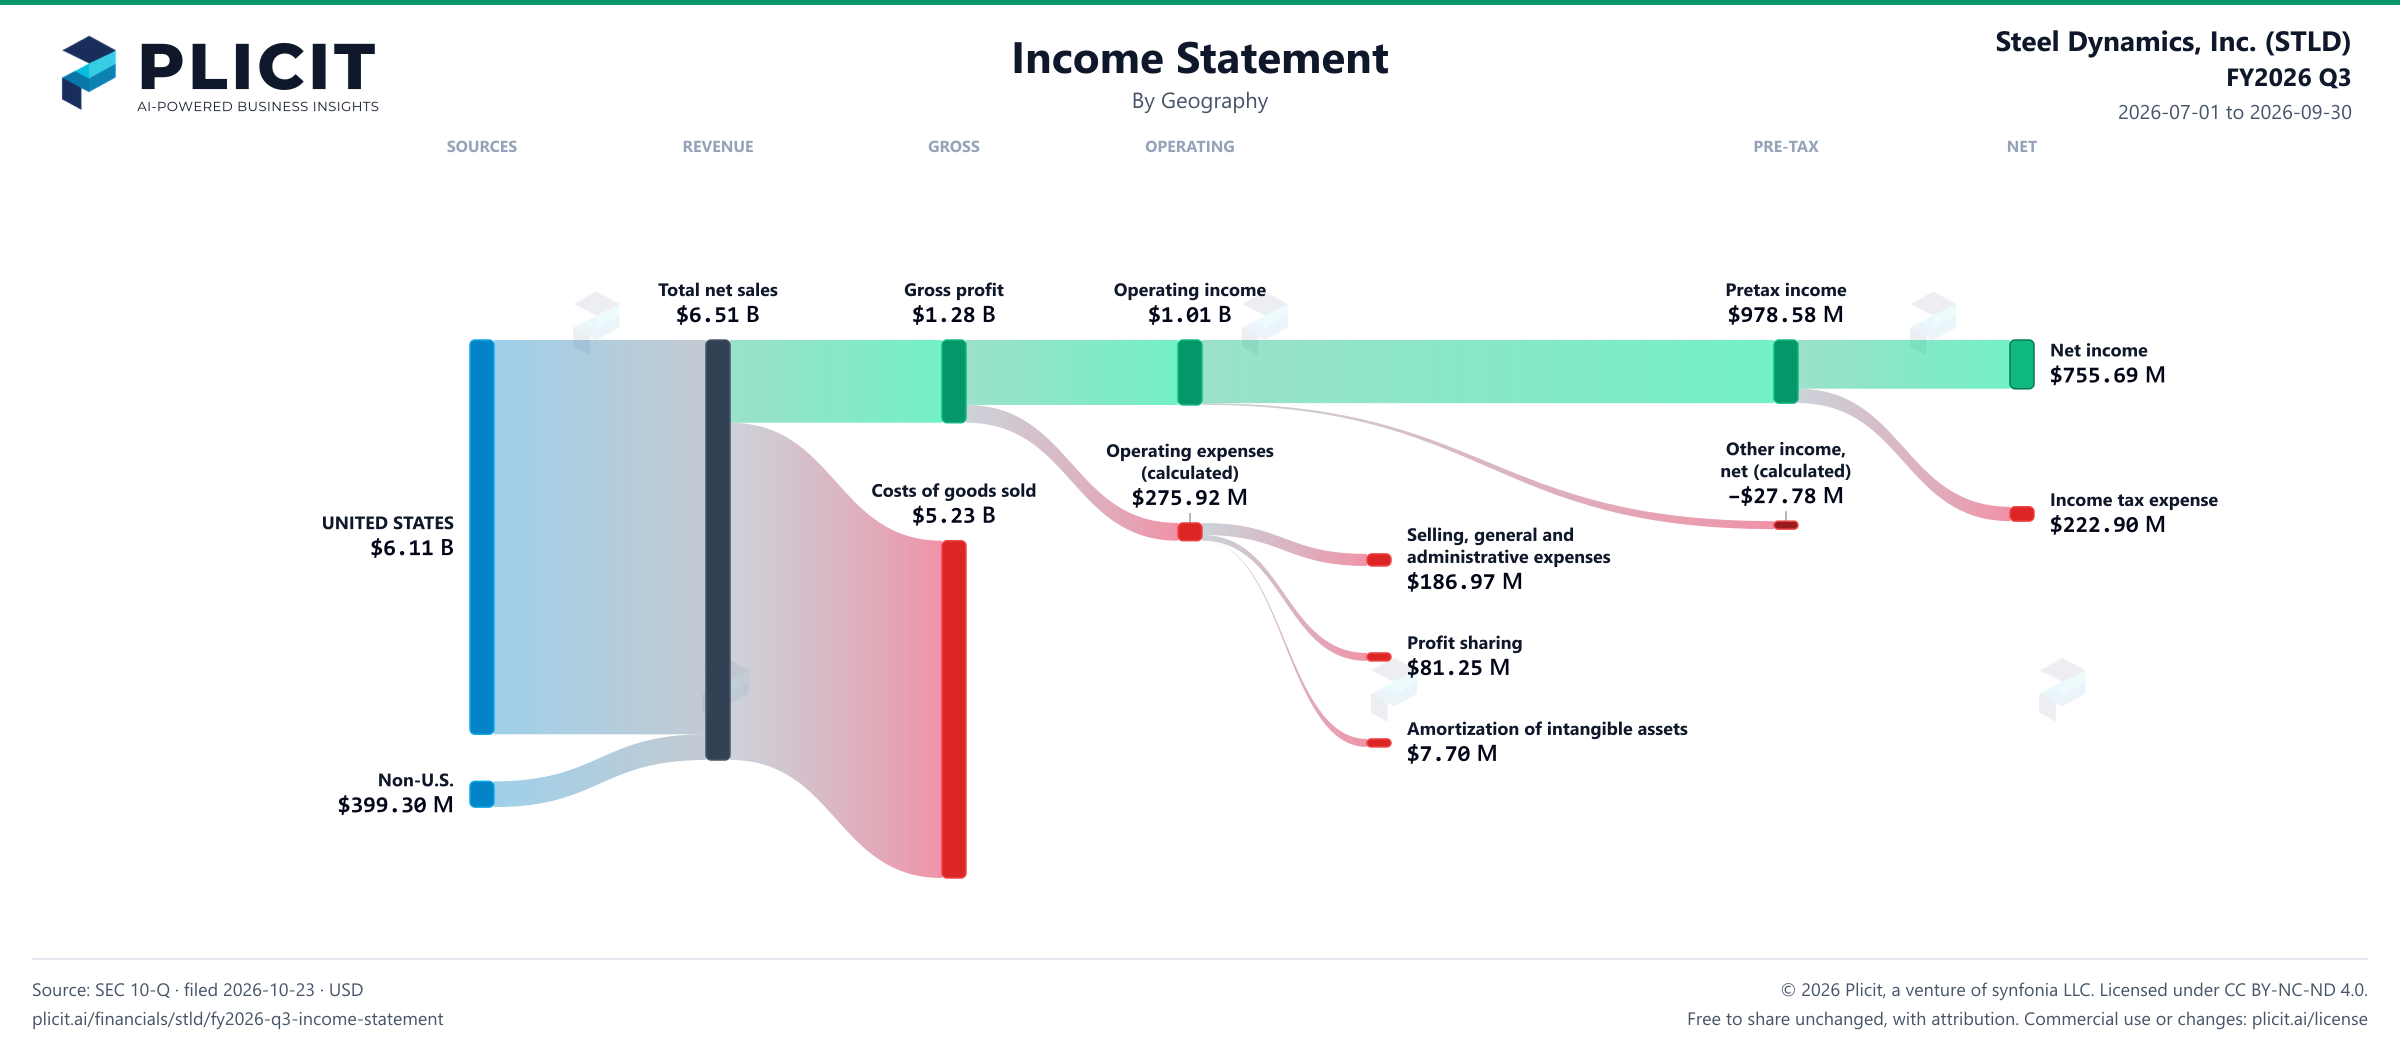
Operating income nearly doubled, to $1.01 B, on sales that grew 35%. Before anyone celebrates, look at who else took a bigger share. Profit-sharing expense rose 92% to $81.25 M, and the interest bill rose 190% to $39.33 M because the company stopped capitalizing as much interest into its new aluminum mill. The tax bill grew 103% to $222.90 M. Meanwhile aluminum sales rose 373%, and its operating loss narrowed by 54% but was still a loss. Those are the costs that sit between the headline and the bottom line.

Gross profit rose $524.41 M, more than the whole $498.61 M gain in operating income. The gross margin rose to 19.7% of sales from 15.7%, and cost of goods sold took 80.3% of sales. Steel fabrication shows the weak spot: its operating income fell 15% because metal spreads contracted 18%. Aluminum is still losing money, although the loss narrowed from a year earlier. Will profit sharing and interest keep rising faster than sales once the aluminum mill is running?

For a reader, the quarter is profitable, and the headline is real: net income was $755.69 M, or 11.6% of sales. But 94% of sales came from the United States, so the result rests on one economy. Diluted earnings per share were $5.26, against $2.74 a year earlier, and the share count fell 2.7% over the same span. The company expects aluminum to improve in the fourth quarter and through 2027; if it does, will the profit-sharing and interest lines keep taking a growing share of sales?
2026-07-01 to 2026-09-30

Revenue by Geography

Swipe to see the full flow
Steel Dynamics, Inc. (STLD) FY2026 Q3 P&L / Income StatementIncome statement for 2026-07-01 through 2026-09-30. View: Geography. Revenue uses this breakdown; costs and expenses retain the consolidated categories.SOURCESREVENUEGROSSOPERATINGPRE-TAXNETUNITED STATESNon-U.S.Total net salesGross profitCosts of goods soldOperating incomeOperating expenses (calculated)Selling, general and administrative expensesProfit sharingAmortization of intangible assetsIncome before income taxesOther income (expense), net (calculated)Net incomeIncome tax expenseTotal net salesTotal net sales$6.51 BGross profitGross profit$1.28 BOperating incomeOperating income$1.01 BIncome before income taxesPretax income$978.58 MNet incomeNet income$755.69 MOperating expenses (calculated)Operating expenses(calculated)$275.92 MCosts of goods soldCosts of goods sold$5.23 BIncome tax expenseIncome tax expense$222.90 MUNITED STATESUNITED STATES$6.11 BSelling, general and administrative expensesSelling, general andadministrative expenses$186.97 MOther income (expense), net (calculated)Other income,net (calculated)−$27.78 MProfit sharingProfit sharing$81.25 MAmortization of intangible assetsAmortization of intangible assets$7.70 MNon-U.S.Non-U.S.$399.30 M
Chart details

Steel Dynamics, Inc. (STLD) FY2026 Q3 P&L / Income Statement

Income statement for 2026-07-01 through 2026-09-30. View: Geography. Revenue uses this breakdown; costs and expenses retain the consolidated categories.

Total net sales
6,509,419,000 US dollars
Costs of goods sold
5,227,132,000 US dollars
Gross profit
1,282,287,000 US dollars
Operating expenses (calculated)
275,920,000 US dollars
Operating income
1,006,367,000 US dollars
Other income (expense), net (calculated)
negative 27,783,000 US dollars
Income before income taxes
978,584,000 US dollars
Income tax expense
222,896,000 US dollars
Net income
755,688,000 US dollars
UNITED STATES
6,110,123,000 US dollars
Non-U.S.
399,296,000 US dollars
Profit sharing
81,250,000 US dollars
Amortization of intangible assets
7,696,000 US dollars
Selling, general and administrative expenses
186,974,000 US dollars

Chart connections

  • Revenue less cost of revenue equals gross profit; gross profit less operating expenses equals operating income.
  • Operating income plus other income or expense equals income before tax. Income before tax less income tax expense or benefit equals net income.
  • Of which attributable to Steel Dynamics, Inc.: $756.00 M; to noncontrolling interests: −$312.00 K.
Steel Dynamics, Inc. (STLD) FY2026 Q3 P&L / Income Statement Sankey chart
Free to share unchanged, with credit to Plicit.ai · CC BY-NC-ND 4.0Download PNG

Intelligent Insights for Investors

How much did Steel Dynamics, Inc.'s sales grow from a year ago?

Sales grew 35% from a year earlier, to $6.51 B this quarter. The comparison is with the same quarter a year before.

Is Steel Dynamics, Inc.'s profit per share growing faster than its profit?

Yes: earnings per share rose 92% this quarter, while profit rose 87%. The average share count fell 2.7%, which accounts for part of the gap.

Did a lower tax rate drive Steel Dynamics, Inc.'s profit growth?

No. Before tax, profit rose 90%, and after tax it rose 87%. The effective tax rate rose to 22.8% from 21.4%, which is why after-tax profit grew more slowly.

How much does Steel Dynamics, Inc. keep after the direct cost of what it sells?

It kept 19.7% of its sales after the direct cost of what it sold, against 15.7% a year earlier. That margin has to cover everything else, from running the business to taxes.

Is Steel Dynamics, Inc. investing more or less in research and equipment than before?

Less, as a share of sales: property and equipment spending was 2.3% of sales this quarter, against 3.4% a year earlier.

How much of Steel Dynamics, Inc.'s sales come from outside its home country?

Only $399.30 M this quarter, 6.1% of the total, came from outside the United States. The rest came from the United States, so its sales lean on one economy.

Intelligent Insights for Lenders

Does Steel Dynamics, Inc. earn enough to cover its interest payments?

Yes. Operating profit covered its interest 25.6 times this quarter, against 37.4 times a year earlier.

Intelligent Insights for Employees

Of every $100 of Steel Dynamics, Inc.'s sales, where does it go?

The biggest bite is the cost of what it sells: 80.3% of sales this quarter. After that and every other cost, 11.6% of sales is left as profit.

Product waitlist

Health Check and Teardown for your own company

A health check uncovers insights of your private books, not a public ticker. Join this list to get notified as soon as we go-live!