
STERLING INFRASTRUCTURE, INC. (STRL) FY2026 Q2 P&L / Income Statement

Revenue by Business Segment by Product and Service

2026-04-01 to 2026-06-30

Swipe to see the full flow
STERLING INFRASTRUCTURE, INC. (STRL) FY2026 Q2 P&L / Income StatementIncome statement for 2026-04-01 through 2026-06-30. View: Segments by Product and Service. Revenue uses this breakdown; costs and expenses retain the consolidated categories.SOURCESREVENUEGROSSOPERATINGPRE-TAXNETE-Infrastructure Solutions RPOsTransportation Solutions RPOs - Heavy HighwayBuilding Solutions RPOs - Commercial - ResidentialTransportation Solutions RPOs - AviationTransportation Solutions RPOs - Other ServicesBuilding Solutions RPOs - Commercial - CommercialRevenuesGross profitCost of revenuesOperating incomeOperating costs, net of other operating income (calculated)General and administrative expenseAcquisition related costsIntangible asset amortizationEarn-out expenseOther operating income, netOther income (expense), net (calculated)Income before income taxesNet income, including noncontrolling interestsIncome tax expenseOther income (expense), net (calculated)Other income,net (calculated)$709.00 KIncome before income taxesPretax income$219.97 MRevenuesRevenues$1.17 BGross profitGross profit$289.96 MOperating incomeOperating income$219.26 MNet income, including noncontrolling interestsNet income$168.65 MOperating costs, net of other operating income (calculated)Operating costs,net (calculated)$70.70 ME-Infrastructure Solutions RPOsE-Infrastructure Solutions RPOs$905.00 MIncome tax expenseIncome tax expense$51.32 MCost of revenuesCost of revenues$878.22 MGeneral and administrative expenseGeneral andadministrative expense$53.13 MAcquisition related costsAcquisition related costs$12.53 MTransportation Solutions RPOs - Heavy HighwayTransportation SolutionsRPOs - Heavy Highway$112.68 MIntangible asset amortizationIntangible asset amortization$7.49 MBuilding Solutions RPOs - Commercial - ResidentialBuilding Solutions RPOs -Commercial - Residential$89.75 MEarn-out expenseEarn-out expense$2.49 MOther operating income, netOther operating income, net−$4.94 MTransportation Solutions RPOs - AviationTransportation SolutionsRPOs - Aviation$22.77 MTransportation Solutions RPOs - Other ServicesTransportation SolutionsRPOs - Other Services$21.24 MBuilding Solutions RPOs - Commercial - CommercialBuilding Solutions RPOs -Commercial - Commercial$16.74 M
Chart details

STERLING INFRASTRUCTURE, INC. (STRL) FY2026 Q2 P&L / Income Statement

Income statement for 2026-04-01 through 2026-06-30. View: Segments by Product and Service. Revenue uses this breakdown; costs and expenses retain the consolidated categories.

Revenues
1,168,179,000 US dollars
Cost of revenues
878,222,000 US dollars
Gross profit
289,957,000 US dollars
Operating costs, net of other operating income (calculated)
70,696,000 US dollars
Operating income
219,261,000 US dollars
Other income (expense), net (calculated)
709,000 US dollars
Income before income taxes
219,970,000 US dollars
Income tax expense
51,324,000 US dollars
Net income, including noncontrolling interests
168,646,000 US dollars
E-Infrastructure Solutions RPOs
905,001,000 US dollars
Building Solutions RPOs - Commercial - Commercial
16,738,000 US dollars
Building Solutions RPOs - Commercial - Residential
89,748,000 US dollars
Transportation Solutions RPOs - Aviation
22,770,000 US dollars
Transportation Solutions RPOs - Heavy Highway
112,681,000 US dollars
Transportation Solutions RPOs - Other Services
21,241,000 US dollars
Acquisition related costs
12,528,000 US dollars
Earn-out expense
2,488,000 US dollars
Intangible asset amortization
7,492,000 US dollars
General and administrative expense
53,130,000 US dollars
Other operating income, net
negative 4,942,000 US dollars

Chart connections

  • Revenue less cost of revenue equals gross profit; gross profit less operating expenses equals operating income.
  • Operating income plus other income or expense equals income before tax. Income before tax less income tax expense or benefit equals net income.
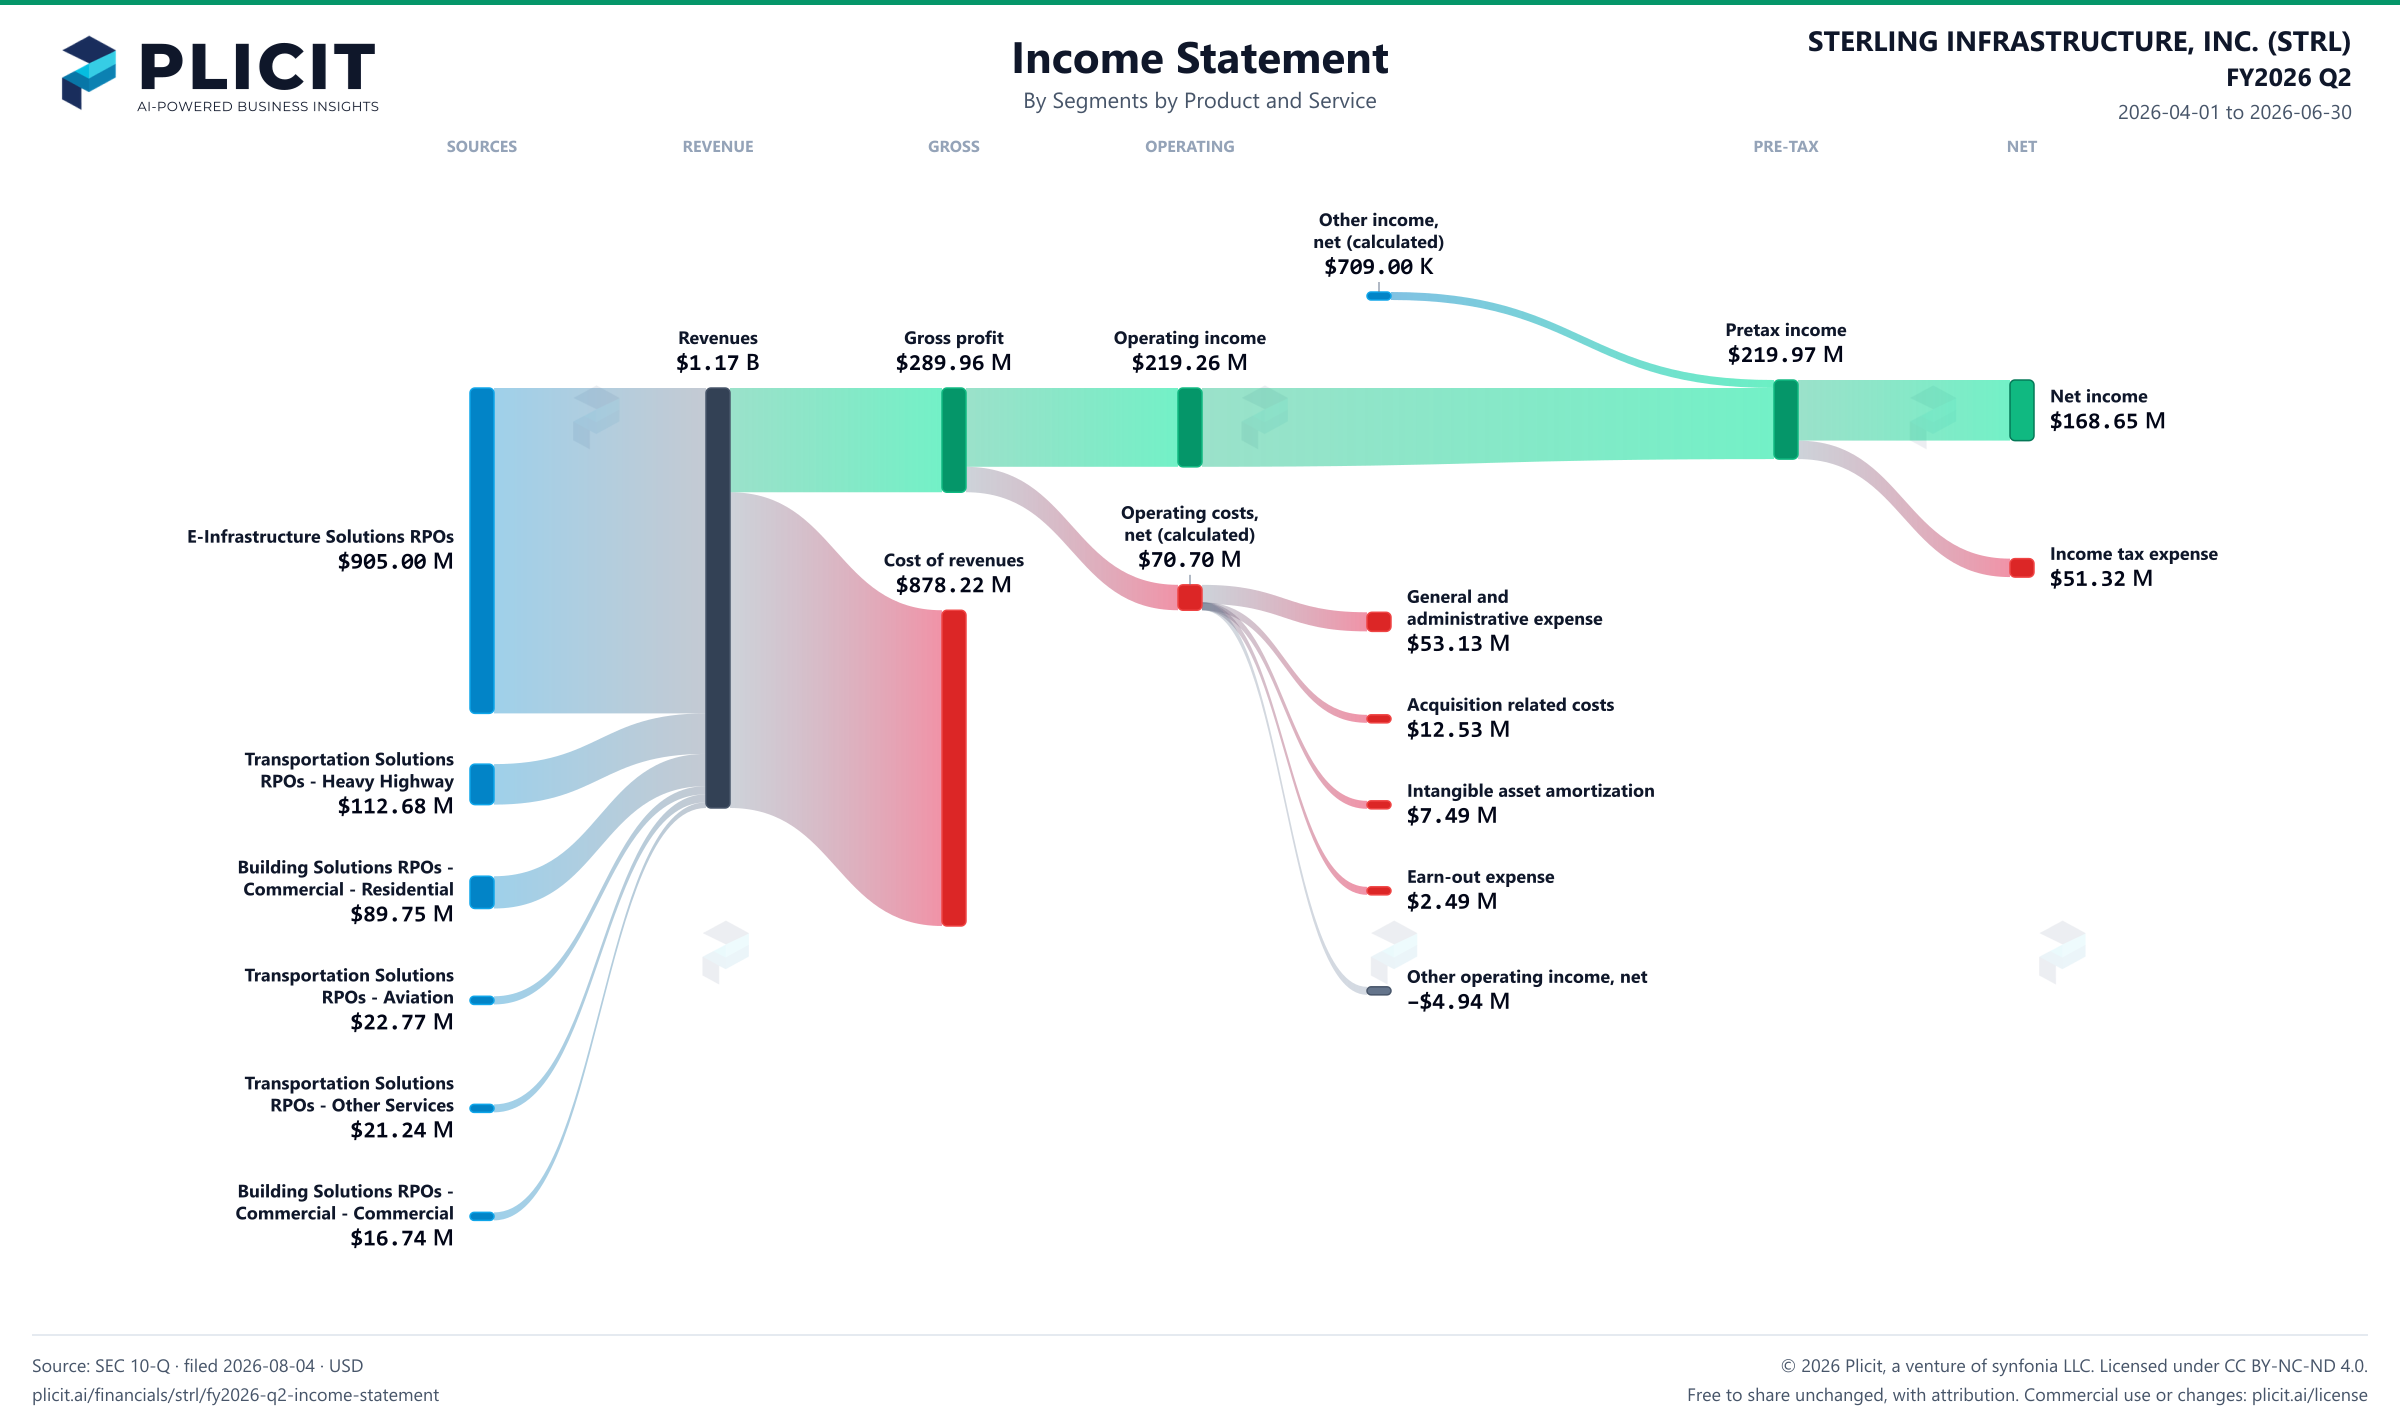
STERLING INFRASTRUCTURE, INC. (STRL) FY2026 Q2 P&L / Income Statement Sankey chart, Segments by Product and Service view
Free to share unchanged, with credit to Plicit.ai · CC BY-NC-ND 4.0Download PNG

Gross margin

24.8%

Gross profit / revenue

Operating margin

18.8%

Operating profit / revenue

Cash conversion

96.3%

Operating cash / net income, same period

Newsletter

Get the teardowns by email

Subscribe if you want the public-company teardowns in your inbox when they're released.

Product waitlist

Health Check and Teardown for your own company

A health check uncovers insights of your private books, not a public ticker. Join this list to get notified as soon as we go-live!