
AT&T INC. (T) FY2026 Q1 Balance Sheet
As of 2026-03-31
Balance Sheet
As of 2026-03-31
Swipe to see the full flow
Chart details
AT&T INC. (T) FY2026 Q1 Balance Sheet
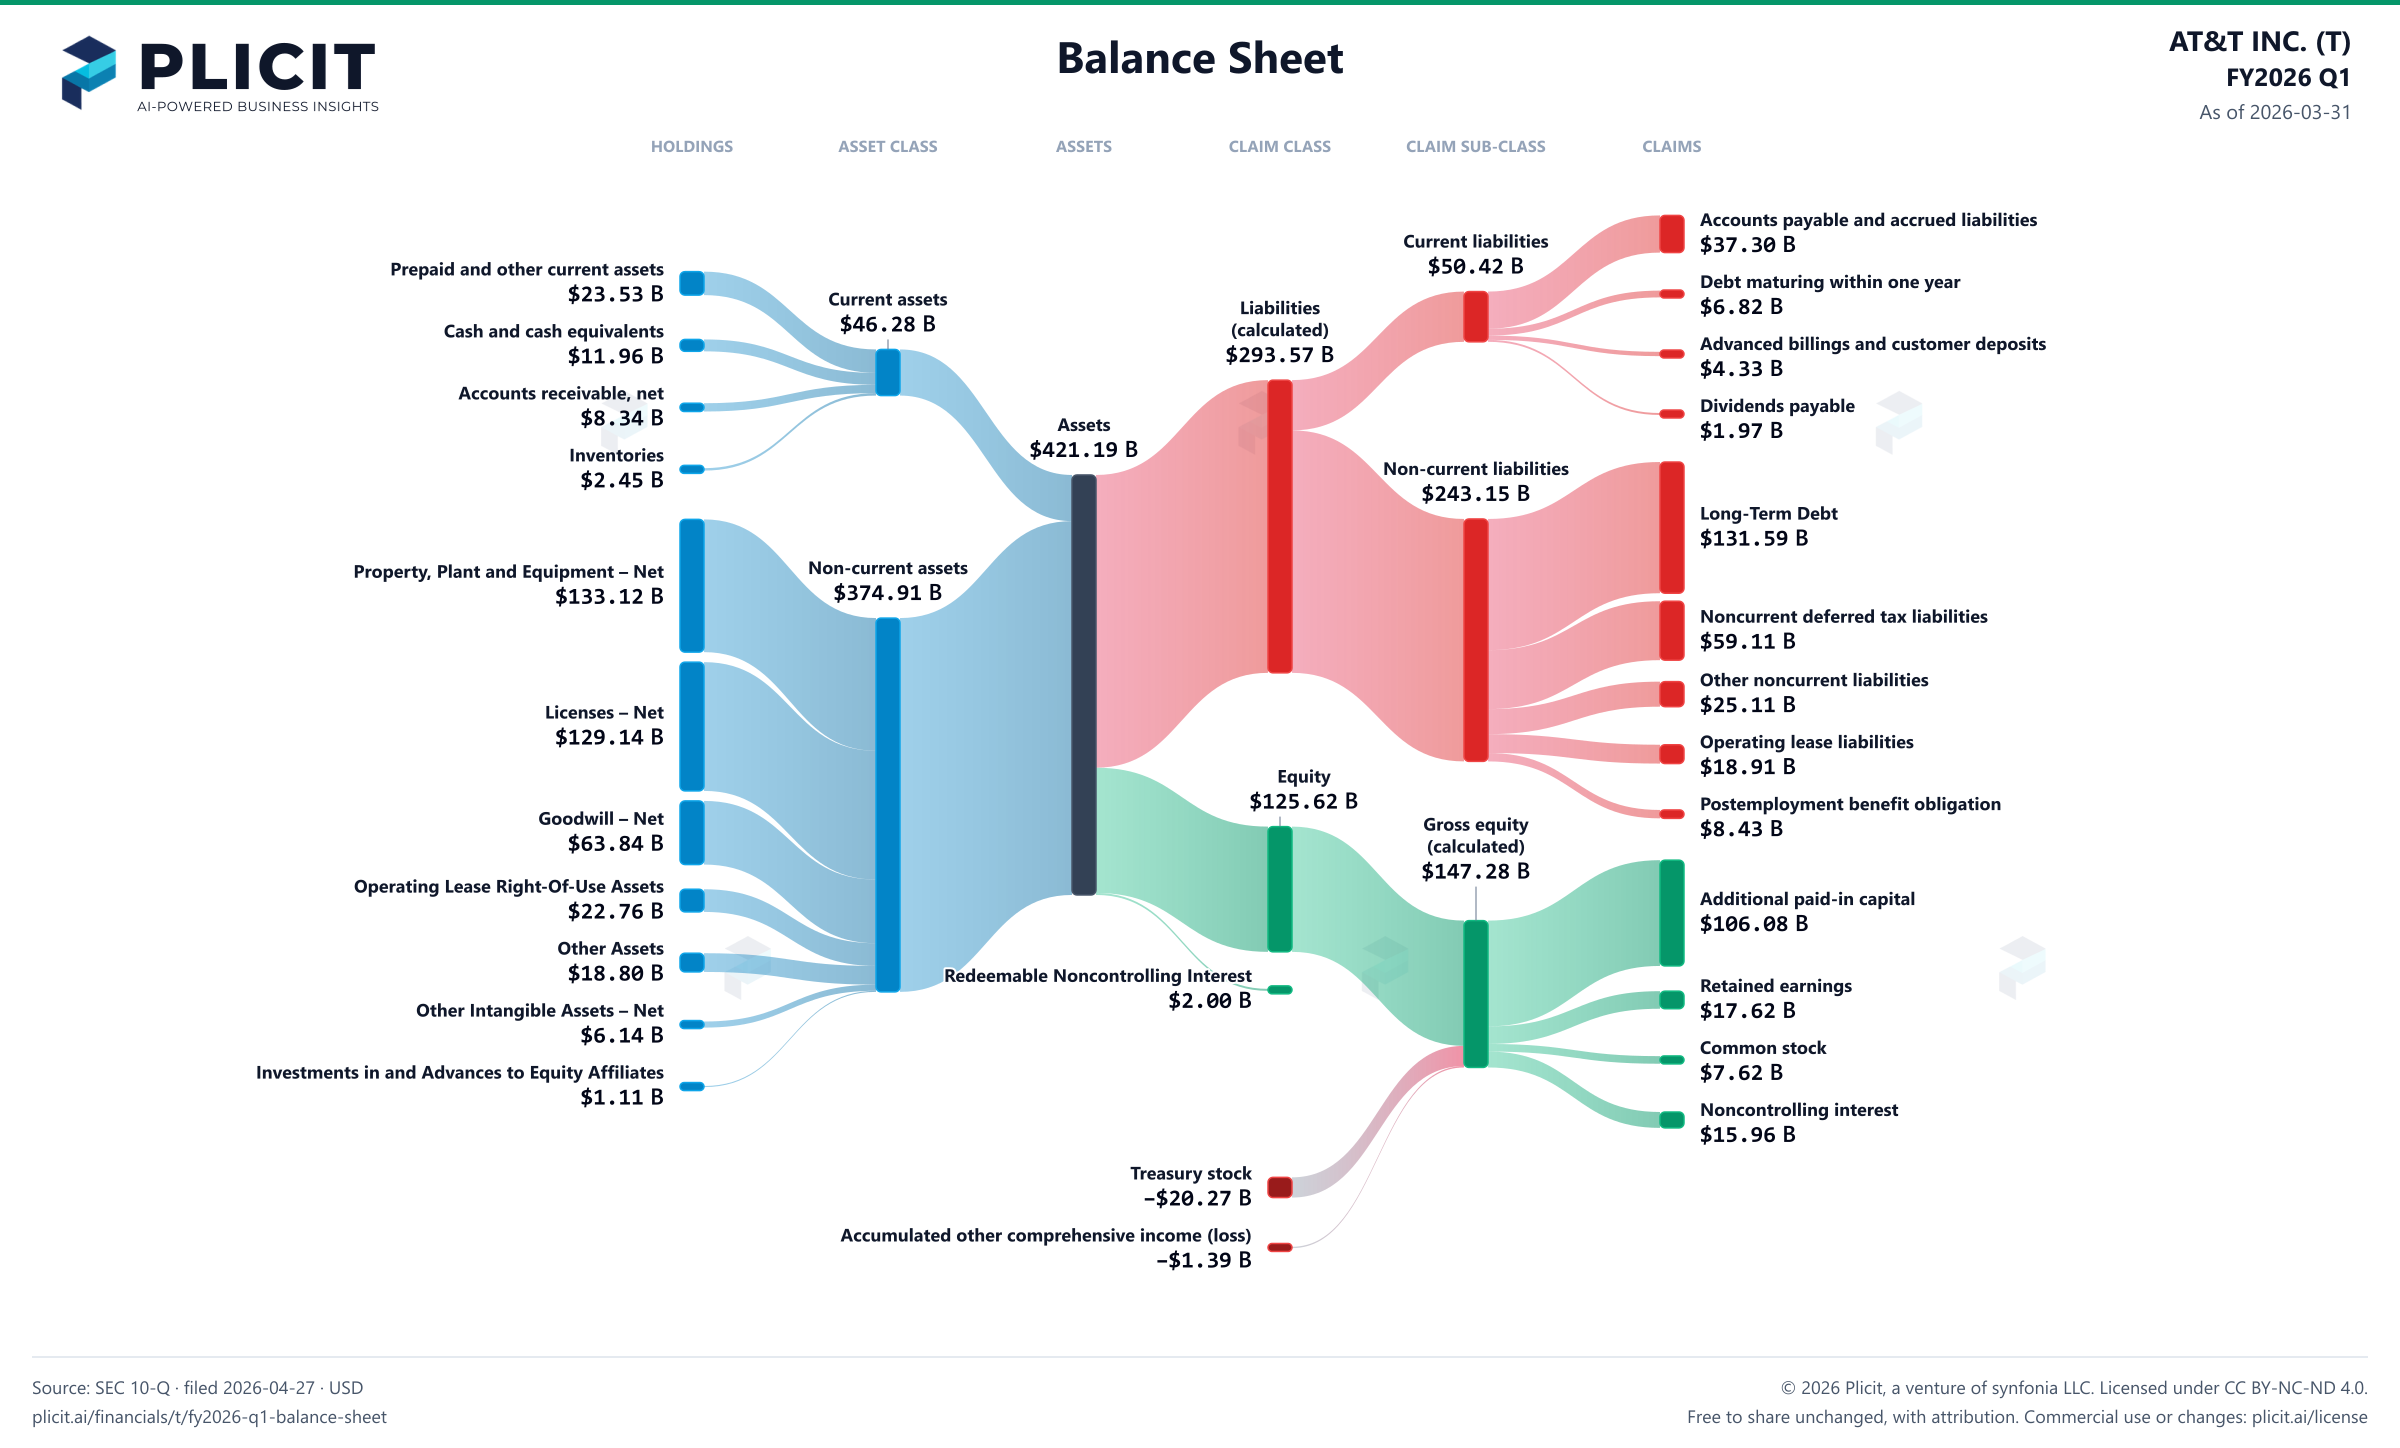
Balance sheet as of 2026-03-31. The chart shows assets, liabilities and equity at that date.
- Assets
- 421,188,000,000 US dollars
- Current assets
- 46,282,000,000 US dollars
- Non-current assets
- 374,906,000,000 US dollars
- Liabilities (calculated)
- 293,566,000,000 US dollars
- Current liabilities
- 50,421,000,000 US dollars
- Non-current liabilities
- 243,145,000,000 US dollars
- Equity
- 125,619,000,000 US dollars
- Redeemable Noncontrolling Interest
- 2,003,000,000 US dollars
- Noncontrolling interest
- 15,959,000,000 US dollars. Included in consolidated equity; this amount is not added again.
- Property, plant and equipment
- 349,454,000,000 US dollars. Part of Property, Plant and Equipment – Net, drawn as one net amount.
- Less: accumulated depreciation and amortization
- negative 216,330,000,000 US dollars. Part of Property, Plant and Equipment – Net, drawn as one net amount.
- Prepaid and other current assets
- 23,532,000,000 US dollars
- Cash and cash equivalents
- 11,964,000,000 US dollars
- Accounts receivable – net of related allowances for credit loss of $363 and $429
- 8,335,000,000 US dollars
- Inventories
- 2,451,000,000 US dollars
- Property, Plant and Equipment – Net
- 133,124,000,000 US dollars
- Licenses – Net
- 129,144,000,000 US dollars
- Goodwill – Net
- 63,838,000,000 US dollars
- Operating Lease Right-Of-Use Assets
- 22,756,000,000 US dollars
- Other Assets
- 18,801,000,000 US dollars
- Other Intangible Assets – Net
- 6,135,000,000 US dollars
- Investments in and Advances to Equity Affiliates
- 1,108,000,000 US dollars
- Accounts payable and accrued liabilities
- 37,304,000,000 US dollars
- Debt maturing within one year
- 6,818,000,000 US dollars
- Advanced billings and customer deposits
- 4,330,000,000 US dollars
- Dividends payable
- 1,969,000,000 US dollars
- Long-Term Debt
- 131,589,000,000 US dollars
- Noncurrent deferred tax liabilities
- 59,113,000,000 US dollars
- Other noncurrent liabilities
- 25,109,000,000 US dollars
- Operating lease liabilities
- 18,907,000,000 US dollars
- Postemployment benefit obligation
- 8,427,000,000 US dollars
- Additional paid-in capital
- 106,084,000,000 US dollars
- Retained earnings
- 17,620,000,000 US dollars
- Common stock ($1 par value, 14,000,000,000 authorized at March 31, 2026 and December 31, 2025: issued 7,620,748,598 at March 31, 2026 and December 31, 2025)
- 7,621,000,000 US dollars
- Preferred stock ($1 par value, 10,000,000 authorized at March 31, 2026 and December 31, 2025) - Series A (48,000 issued and outstanding at March 31, 2026 and December 31, 2025)
- 0 US dollars
- Preferred stock ($1 par value, 10,000,000 authorized at March 31, 2026 and December 31, 2025) - Series B (20,000 issued and 0 outstanding at March 31, 2026 and December 31, 2025)
- 0 US dollars
- Preferred stock ($1 par value, 10,000,000 authorized at March 31, 2026 and December 31, 2025) - Series C (70,000 issued and outstanding at March 31, 2026 and December 31, 2025)
- 0 US dollars
- Noncontrolling interest
- 15,959,000,000 US dollars
- Treasury stock (655,850,883 at March 31, 2026 and 583,246,242 at December 31, 2025, at cost)
- negative 20,273,000,000 US dollars
- Accumulated other comprehensive income (loss)
- negative 1,392,000,000 US dollars
- Gross equity (calculated)
- 147,284,000,000 US dollars. Net equity plus the magnitudes of its negative contributions equals gross positive equity. The negative contributions enter this reconciliation as add-backs; their filed signs stay negative.
Chart connections
- Assets equal liabilities plus temporary equity plus consolidated equity. Consolidated equity includes noncontrolling interests when reported.
- Treasury shares and other negative equity contributions reduce equity.
Free to share unchanged, with credit to Plicit.ai · CC BY-NC-ND 4.0Download PNG
Product waitlist
Health Check and Teardown for your own company
A health check uncovers insights of your private books, not a public ticker. Join this list to get notified as soon as we go-live!