
Tamboran Resources Corporation (TBN) FY2026 Annual Balance Sheet

Balance Sheet

As of 2026-06-30

Swipe to see the full flow
Tamboran Resources Corporation (TBN) FY2026 Annual Balance SheetBalance sheet as of 2026-06-30. The chart shows assets, liabilities and equity at that date.Current liabilities$93.06 MCurrent assets$243.19 MLiabilities$184.42 MAssets$1.15 BNon-current liabilities$91.36 MEquity$967.70 MNon-current assets$910.79 MGross equity(calculated)$1.16 BRedeemable noncontrolling interest$1.86 MHOLDINGSASSET CLASSASSETSCLAIM CLASSCLAIM SUB-CLASSCLAIMSCash and cash equivalentsRestricted cashPrepaid expenses and other current assetsATO receivableJoint interest billingsOther receivablesNatural gas properties, successful efforts method - Unproved propertiesNatural gas properties, successful efforts method - Assets under construction - natural gas equipmentFinance lease right-of-use assetPrepaid expenses and other non-current assetsOperating lease right-of-use assetsProperty, plant and equipment, netAccounts payable and accrued expensesCurrent portion of finance lease obligationOther current liabilitiesCurrent portion of operating lease obligationsLong-term debt, netAsset retirement obligationsFinance lease obligationOperating lease obligationsOther non-current liabilitiesAdditional paid-in capitalCommon stock, $0.001 par value; 10,000,000,000 common stock authorized; 34,872,663 and 16,717,289 common stock issued and outstanding as of June 30, 2026 and 2025, respectivelyNoncontrolling interestCurrent assetsNon-current assetsAssetsCurrent liabilitiesNon-current liabilitiesLiabilitiesEquityGross equity (calculated)Accumulated deficitAccumulated other comprehensive lossRedeemable noncontrolling interestAccounts payable and accrued expensesAccounts payable and accrued expenses$73.74 MCash and cash equivalentsCash and cash equivalents$219.14 MCurrent liabilitiesCurrent liabilities$93.06 MCurrent portion of finance lease obligationCurrent portion of finance lease obligation$14.41 MCurrent assetsCurrent assets$243.19 MRestricted cashRestricted cash$11.96 MOther current liabilitiesOther current liabilities$3.01 MLiabilitiesLiabilities$184.42 MPrepaid expenses and other current assetsPrepaid expenses and other current assets$6.46 MCurrent portion of operating lease obligationsCurrent portion of operating lease obligations$1.90 MATO receivableATO receivable$3.74 MLong-term debt, netLong-term debt, net$59.04 MAssetsAssets$1.15 BJoint interest billingsJoint interest billings$1.47 MAsset retirement obligationsAsset retirement obligations$22.14 MNon-current liabilitiesNon-current liabilities$91.36 MOther receivablesOther receivables$430.00 KFinance lease obligationFinance lease obligation$8.35 MEquityEquity$967.70 MOperating lease obligationsOperating lease obligations$1.02 MOther non-current liabilitiesOther non-current liabilities$811.00 KNon-current assetsNon-current assets$910.79 MGross equity (calculated)Gross equity(calculated)$1.16 BNatural gas properties, successful efforts method - Unproved propertiesNatural gas properties, successfulefforts method - Unproved properties$807.04 MAdditional paid-in capitalAdditional paid-in capital$990.36 MNatural gas properties, successful efforts method - Assets under construction - natural gas equipmentNatural gas properties, successful efforts method -Assets under construction - natural gas equipment$72.29 MRedeemable noncontrolling interestRedeemable noncontrolling interest$1.86 MFinance lease right-of-use assetFinance lease right-of-use asset$14.35 MPrepaid expenses and other non-current assetsPrepaid expenses and other non-current assets$13.67 MCommon stock, $0.001 par value; 10,000,000,000 common stock authorized; 34,872,663 and 16,717,289 common stock issued and outstanding as of June 30, 2026 and 2025, respectivelyCommon stock$35.00 KOperating lease right-of-use assetsOperating lease right-of-use assets$2.71 MNoncontrolling interestNoncontrolling interest$171.47 MProperty, plant and equipment, netProperty, plant and equipment, net$744.00 KAccumulated deficitAccumulated deficit−$193.36 MAccumulated other comprehensive lossAccumulated other comprehensive loss−$812.00 K
Chart details

Tamboran Resources Corporation (TBN) FY2026 Annual Balance Sheet

Balance sheet as of 2026-06-30. The chart shows assets, liabilities and equity at that date.

Assets
1,153,982,000 US dollars
Current assets
243,193,000 US dollars
Non-current assets
910,789,000 US dollars
Liabilities
184,421,000 US dollars
Current liabilities
93,057,000 US dollars
Non-current liabilities
91,364,000 US dollars
Equity
967,698,000 US dollars
Redeemable noncontrolling interest
1,863,000 US dollars
Noncontrolling interest
171,474,000 US dollars. Included in consolidated equity; this amount is not added again.
Cash and cash equivalents
219,135,000 US dollars
Restricted cash
11,960,000 US dollars
Prepaid expenses and other current assets
6,461,000 US dollars
ATO receivable
3,735,000 US dollars
Joint interest billings
1,472,000 US dollars
Other receivables
430,000 US dollars
Natural gas properties, successful efforts method - Unproved properties
807,036,000 US dollars
Natural gas properties, successful efforts method - Assets under construction - natural gas equipment
72,287,000 US dollars
Finance lease right-of-use asset
14,345,000 US dollars
Prepaid expenses and other non-current assets
13,672,000 US dollars
Operating lease right-of-use assets
2,705,000 US dollars
Property, plant and equipment, net
744,000 US dollars
Accounts payable and accrued expenses
73,742,000 US dollars
Current portion of finance lease obligation
14,410,000 US dollars
Other current liabilities
3,008,000 US dollars
Current portion of operating lease obligations
1,897,000 US dollars
Advance against joint interest billings
0 US dollars
Long-term debt, net
59,043,000 US dollars
Asset retirement obligations
22,138,000 US dollars
Finance lease obligation
8,354,000 US dollars
Operating lease obligations
1,018,000 US dollars
Other non-current liabilities
811,000 US dollars
Additional paid-in capital
990,356,000 US dollars
Common stock, $0.001 par value; 10,000,000,000 common stock authorized; 34,872,663 and 16,717,289 common stock issued and outstanding as of June 30, 2026 and 2025, respectively
35,000 US dollars
Noncontrolling interest
171,474,000 US dollars
Accumulated deficit
negative 193,355,000 US dollars
Accumulated other comprehensive loss
negative 812,000 US dollars
Gross equity (calculated)
1,161,865,000 US dollars. Net equity plus the magnitudes of its negative contributions equals gross positive equity. The negative contributions enter this reconciliation as add-backs; their filed signs stay negative.

Chart connections

  • Assets equal liabilities plus temporary equity plus consolidated equity. Consolidated equity includes noncontrolling interests when reported.
  • Treasury shares and other negative equity contributions reduce equity.
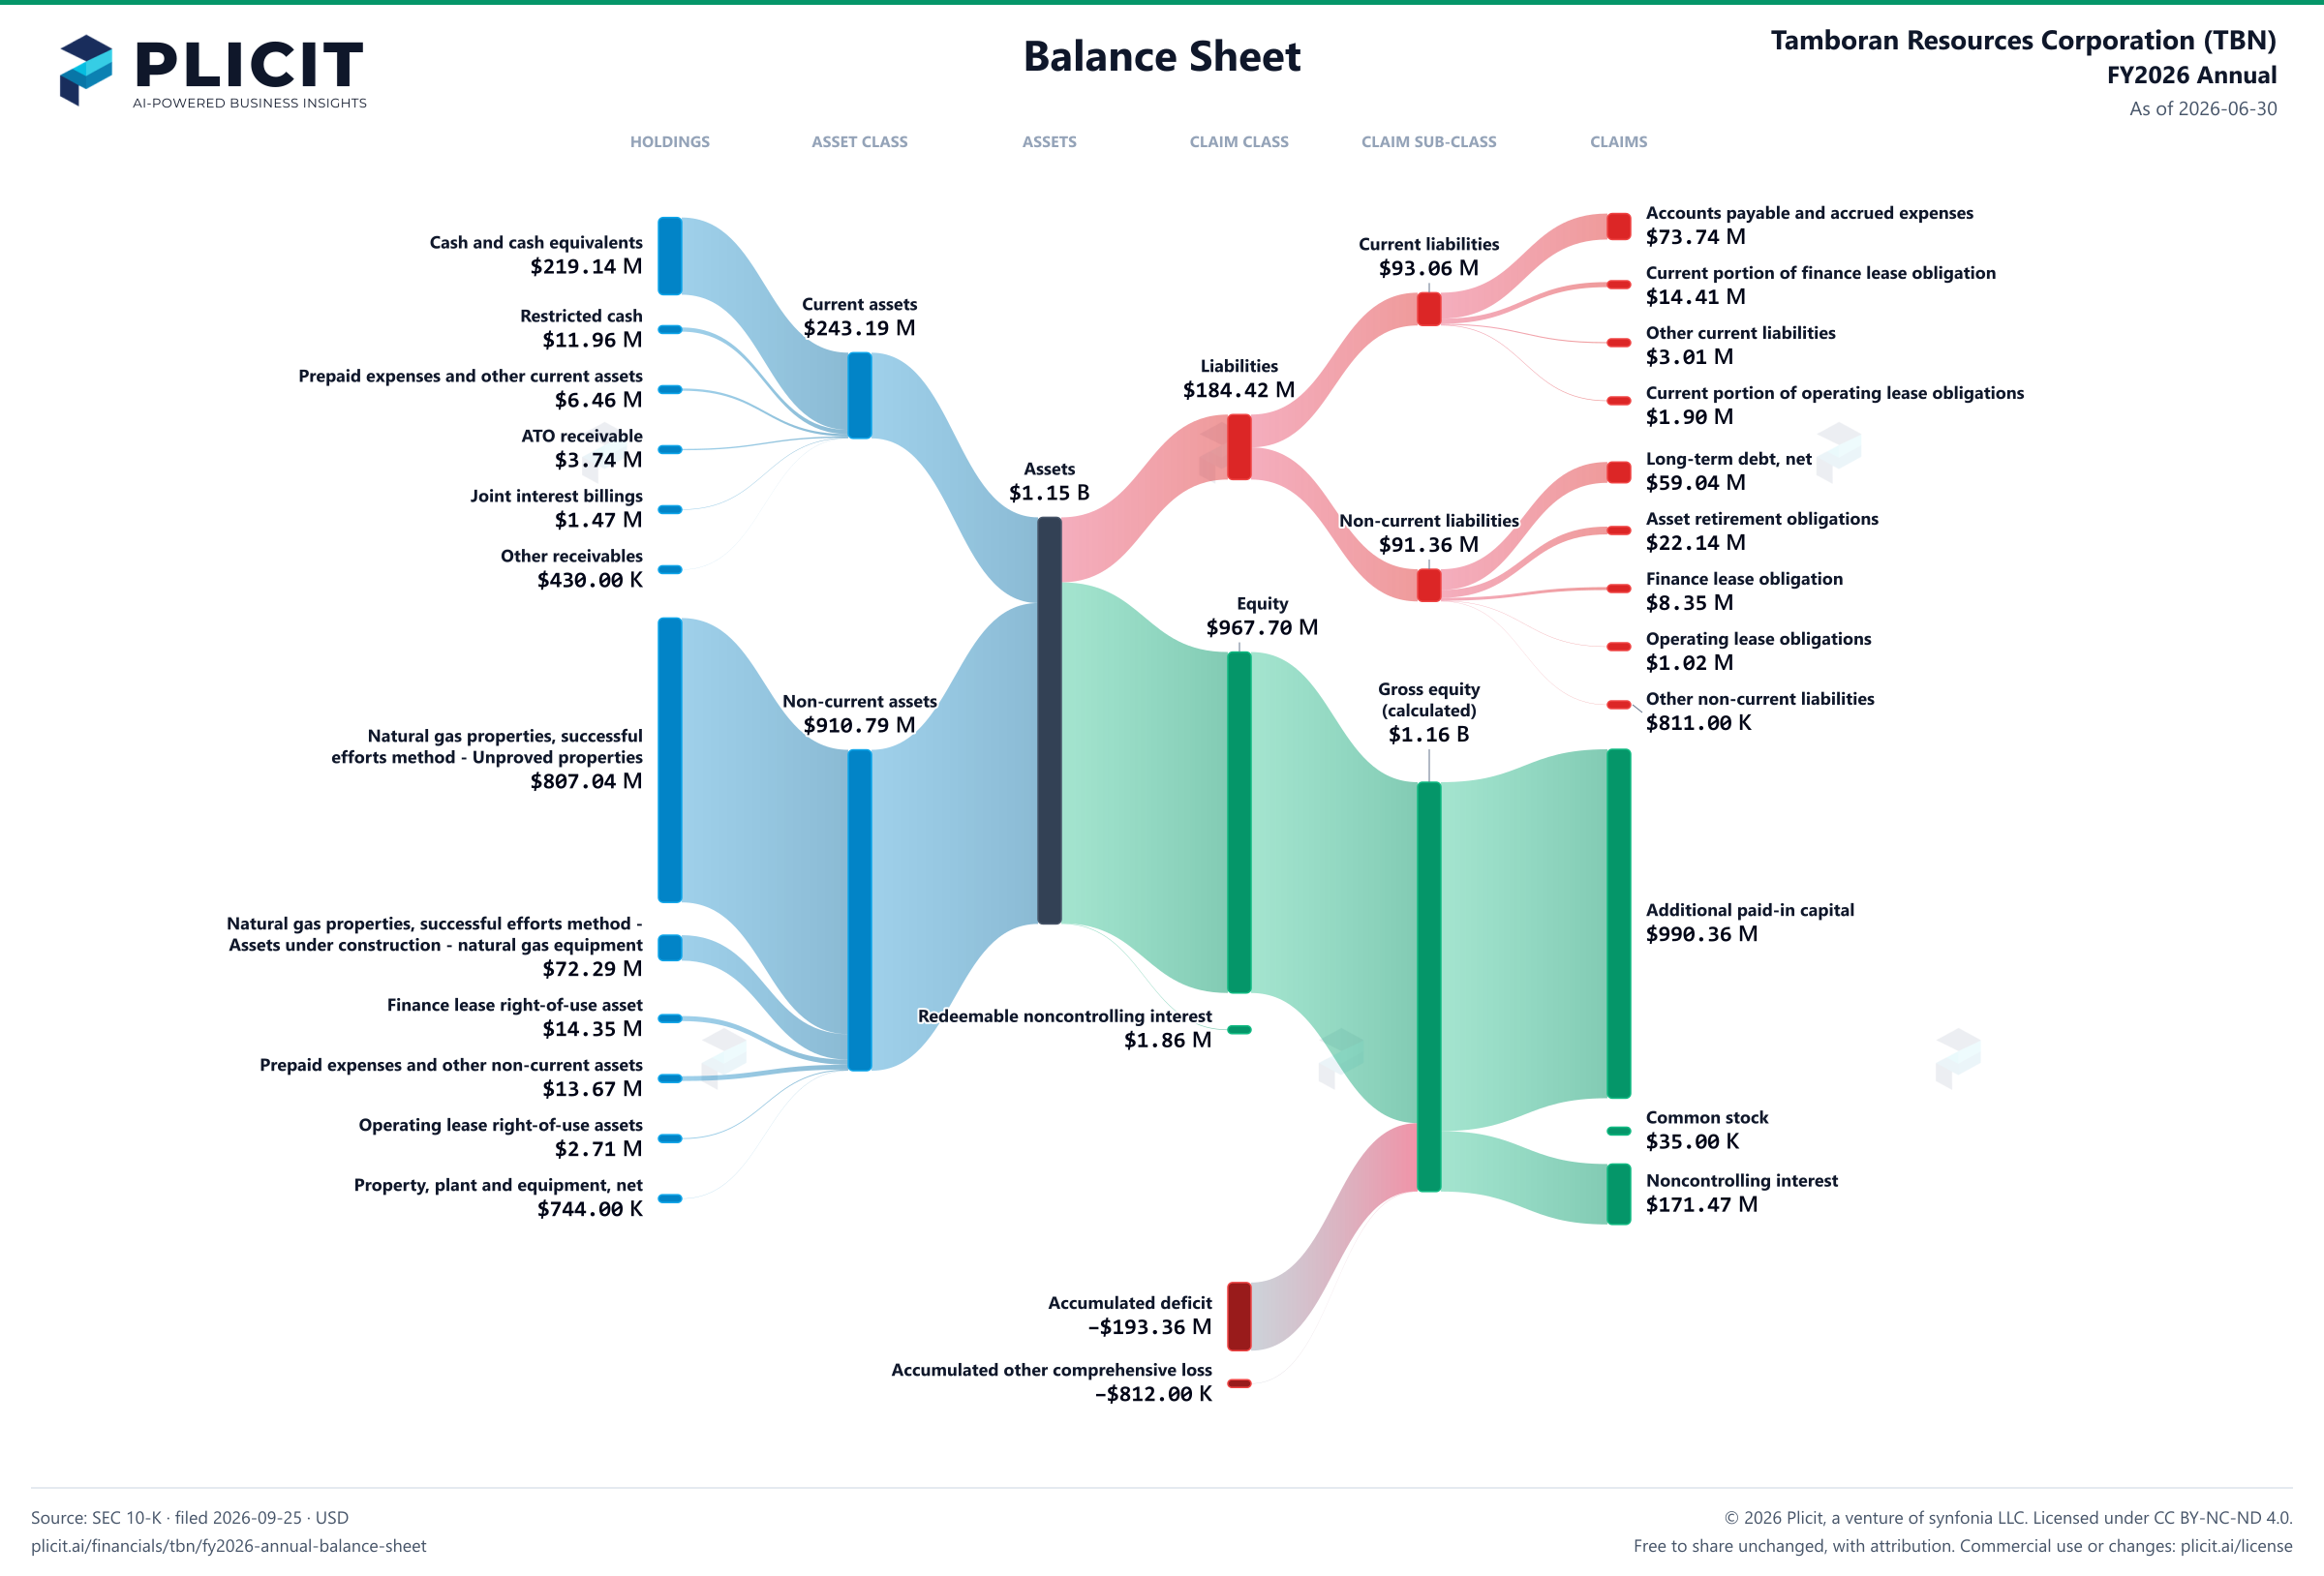
Tamboran Resources Corporation (TBN) FY2026 Annual Balance Sheet Sankey chart
Free to share unchanged, with credit to Plicit.ai · CC BY-NC-ND 4.0Download PNG

Newsletter

Get the teardowns by email

Subscribe if you want the public-company teardowns in your inbox when they're released.

Product waitlist

Health Check and Teardown for your own company

A health check uncovers insights of your private books, not a public ticker. Join this list to get notified as soon as we go-live!