
TELEDYNE TECHNOLOGIES INC (TDY) FY2026 YTD Q2 P&L / Income Statement

2025-12-29 to 2026-06-28

Swipe to see the full flow
TELEDYNE TECHNOLOGIES INC (TDY) FY2026 YTD Q2 P&L / Income StatementIncome statement for 2025-12-29 through 2026-06-28. View: Business segment by customer. Revenue uses this breakdown; costs and expenses retain the consolidated categories.SOURCESREVENUEGROSSOPERATINGPRE-TAXNETDigital Imaging - OtherInstrumentation - OtherDigital Imaging - U.S. Govt.Aerospace and Defense Electronics - OtherAerospace and Defense Electronics - U.S. Govt.Engineered Systems - U.S. Govt.Instrumentation - U.S. Govt.Engineered Systems - OtherNet salesGross profit (calculated)Cost of salesOperating income (loss)Operating expenses (calculated)Selling, general and administrativeResearch and developmentAcquired intangible asset amortizationIncome (loss) before income taxesOther income (expense), net (calculated)Net income (loss) including noncontrolling interestProvision (benefit) for income taxesGross profit (calculated)Gross profit(calculated)$1.41 BOperating income (loss)Operatingincome (loss)$627.40 MIncome (loss) before income taxesIncome (loss)before income taxes$600.00 MNet salesNet sales$3.22 BNet income (loss) including noncontrolling interestNet income(loss) includingnoncontrolling interest$478.50 MDigital Imaging - OtherDigital Imaging - Other$1.31 BOperating expenses (calculated)Operating expenses(calculated)$784.50 MProvision (benefit) for income taxesProvision (benefit)for income taxes$121.50 MSelling, general and administrativeSelling, general and administrative$496.10 MOther income (expense), net (calculated)Other income,net (calculated)−$27.40 MInstrumentation - OtherInstrumentation - Other$683.60 MCost of salesCost of sales$1.81 BResearch and developmentResearch and development$174.80 MDigital Imaging - U.S. Govt.Digital Imaging - U.S. Govt.$371.00 MAcquired intangible asset amortizationAcquired intangibleasset amortization$113.60 MAerospace and Defense Electronics - OtherAerospace and DefenseElectronics - Other$365.60 MAerospace and Defense Electronics - U.S. Govt.Aerospace and DefenseElectronics - U.S. Govt.$198.30 MEngineered Systems - U.S. Govt.Engineered Systems - U.S. Govt.$192.10 MInstrumentation - U.S. Govt.Instrumentation - U.S. Govt.$65.60 MEngineered Systems - OtherEngineered Systems - Other$31.80 M
Chart details

TELEDYNE TECHNOLOGIES INC (TDY) FY2026 YTD Q2 P&L / Income Statement

Income statement for 2025-12-29 through 2026-06-28. View: Business segment by customer. Revenue uses this breakdown; costs and expenses retain the consolidated categories.

Net sales
3,222,600,000 US dollars
Cost of sales
1,810,700,000 US dollars
Gross profit (calculated)
1,411,900,000 US dollars
Operating expenses (calculated)
784,500,000 US dollars
Operating income (loss)
627,400,000 US dollars
Other income (expense), net (calculated)
negative 27,400,000 US dollars
Income (loss) before income taxes
600,000,000 US dollars
Provision (benefit) for income taxes
121,500,000 US dollars
Net income (loss) including noncontrolling interest
478,500,000 US dollars
Aerospace and Defense Electronics - Other
365,600,000 US dollars
Aerospace and Defense Electronics - U.S. Govt.
198,300,000 US dollars
Digital Imaging - Other
1,314,600,000 US dollars
Digital Imaging - U.S. Govt.
371,000,000 US dollars
Engineered Systems - Other
31,800,000 US dollars
Engineered Systems - U.S. Govt.
192,100,000 US dollars
Instrumentation - Other
683,600,000 US dollars
Instrumentation - U.S. Govt.
65,600,000 US dollars
Selling, general and administrative
496,100,000 US dollars
Acquired intangible asset amortization
113,600,000 US dollars
Research and development
174,800,000 US dollars

Chart connections

  • Revenue less cost of revenue equals gross profit; gross profit less operating expenses equals operating income.
  • Operating income plus other income or expense equals income before tax. Income before tax less income tax expense or benefit equals net income.
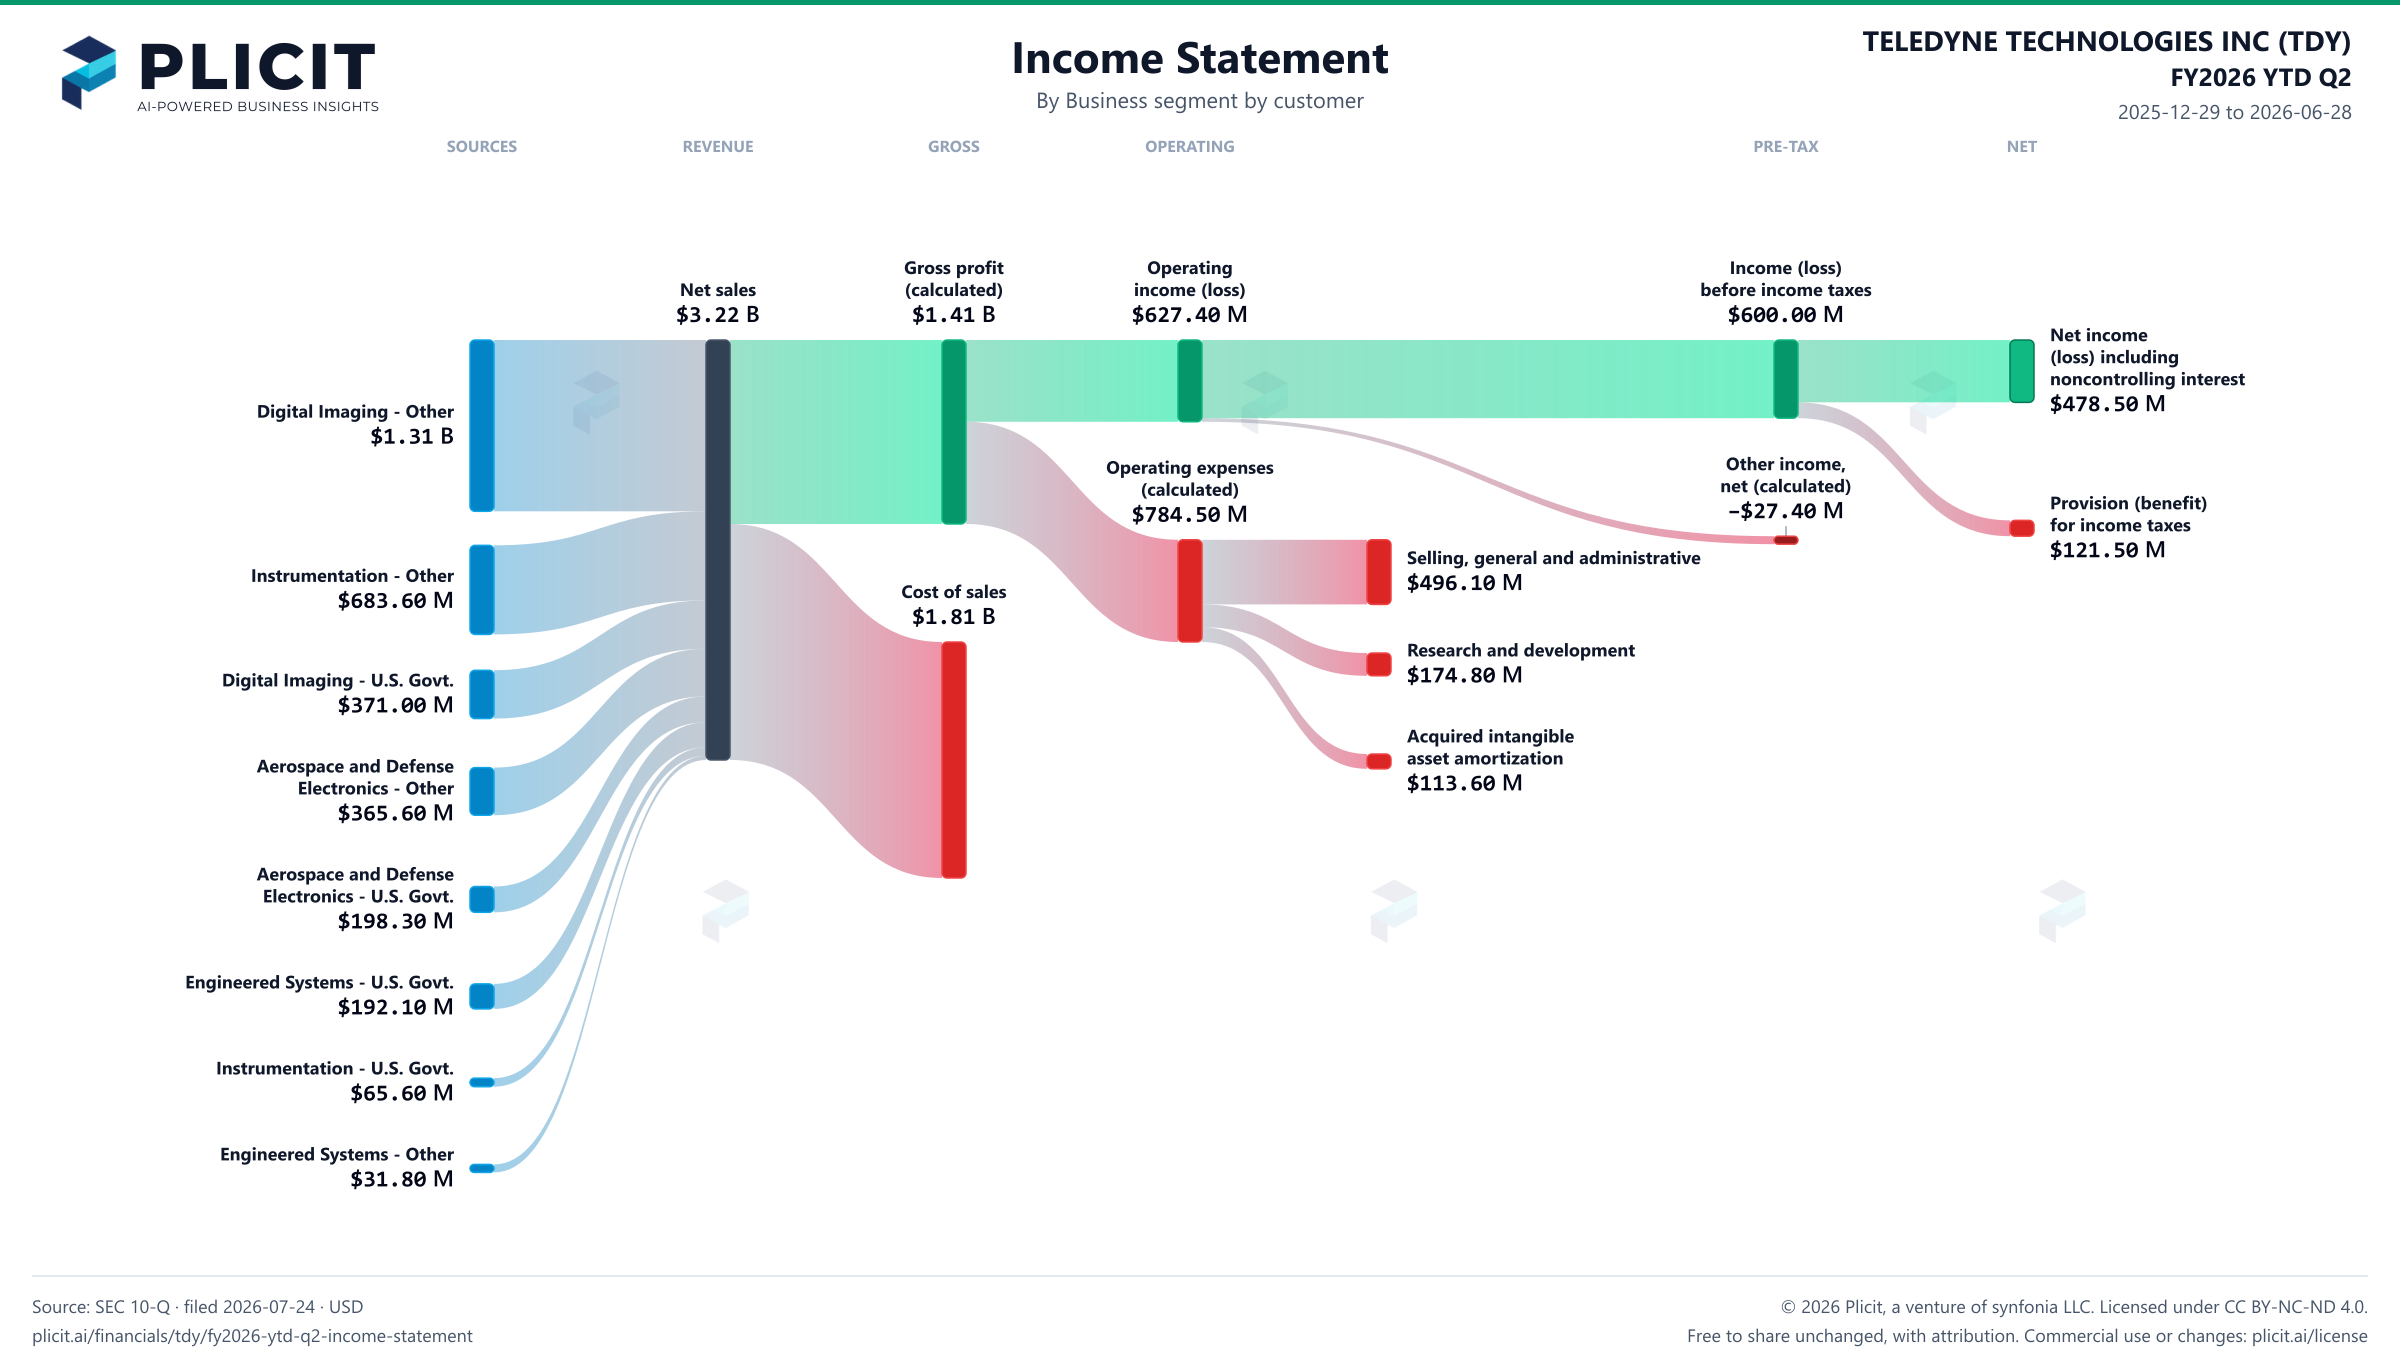
TELEDYNE TECHNOLOGIES INC (TDY) FY2026 YTD Q2 Revenue by Business Segment by Customer Sankey chart
Free to share unchanged, with credit to Plicit.ai · CC BY-NC-ND 4.0Download PNG

Gross margin

43.8%

Gross profit / revenue

Operating margin

19.5%

Operating profit / revenue

Cash conversion

114.8%

Operating cash / net income, same period

Newsletter

Get the teardowns by email

Subscribe if you want the public-company teardowns in your inbox when they're released.

Product waitlist

Health Check and Teardown for your own company

A health check uncovers insights of your private books, not a public ticker. Join this list to get notified as soon as we go-live!